Abstract
Large-scale autonomous driving datasets such as the Waymo Open Motion Dataset (WOMD) provide
rich scenario data with detailed lane graphs, vehicle trajectories, and traffic signal states.
However, we don't know what intersection types the training data actually covers
— scenarios exist as isolated coordinate frames with no connection to real-world road
networks, making it impossible to assess geographic bias or coverage gaps.
We present WayGraph, a method for mapping WOMD scenarios onto
real-world OpenStreetMap (OSM) road networks using
star pattern fingerprinting. Our approach extracts a compact 48-dimensional
topology descriptor from each intersection's lane graph, encoding the center intersection
properties and its 1-hop neighborhood structure. By hierarchically matching these fingerprints
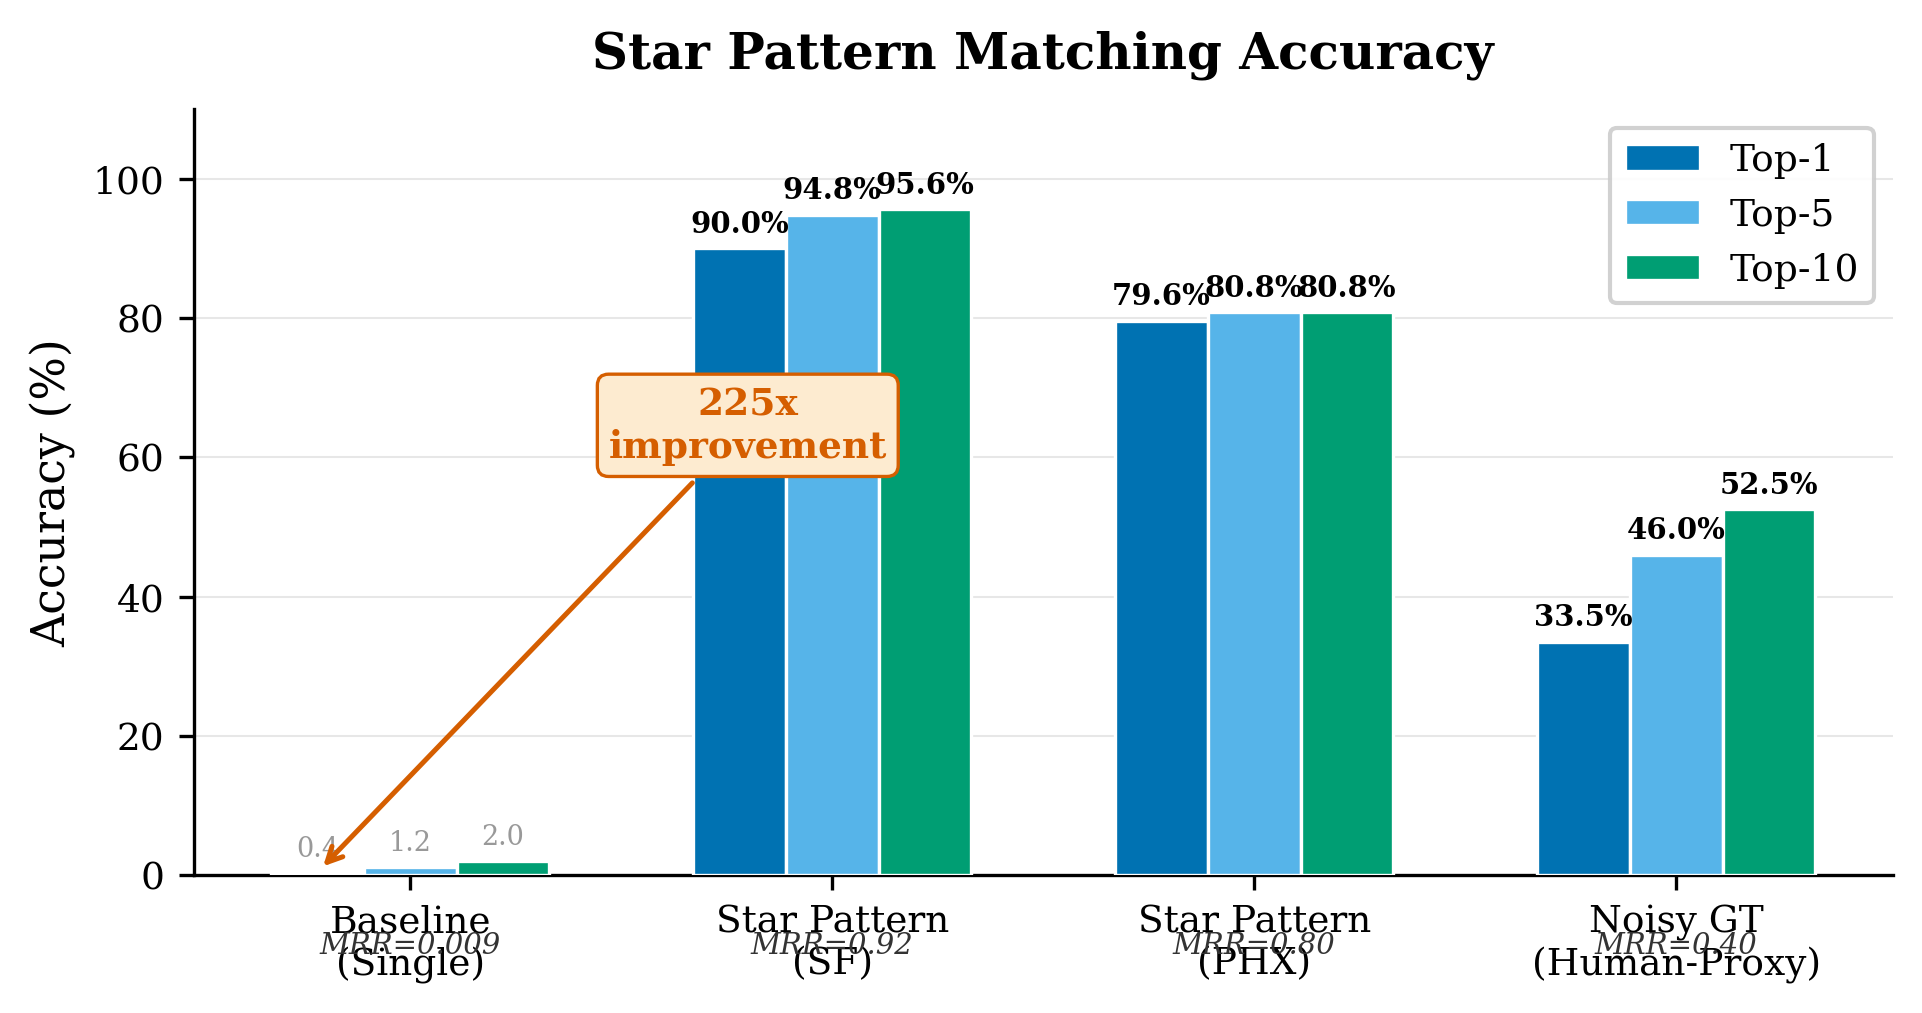
against a database of 5,904 OSM intersections, we achieve 90% top-1 accuracy
on San Francisco scenarios.
This mapping reveals the geographic blind spots in training data —
which intersection types are over- or under-represented, and how dataset composition
(e.g., San Francisco's grid networks) may limit generalizability to cities with different
road topologies (e.g., Montreal's diagonal streets and irregular intersections).
Furthermore, we demonstrate temporal continuity validation —
overlapping 9.1s scenario windows can be chained into continuous driving sequences
(483 connections, position error <0.01m), enabling corridor-level traffic analysis
and providing independent validation of our matching accuracy (56% path connectivity vs 3.9% baseline, p<0.001).
90%
Top-1 matching accuracy
on San Francisco OSM
48D
Star pattern vector
6 center + 6×7 arm features
71K
WOMD scenarios
from 1,000 shards
5,904
OSM star patterns
in San Francisco
Key Contributions:
- Star Pattern Fingerprinting: A novel 48-dimensional topology descriptor that captures intersection type, approach directions, traffic controls, road types, lane counts, and 1-hop neighborhood structure
- Training Data Coverage Analysis: Hierarchical matching pipeline that maps WOMD scenarios onto OSM road networks, revealing which intersection types are covered and where geographic blind spots exist (90% top-1 accuracy)
- Traffic Data Extraction: Enables extraction of turning ratios, speed distributions, and gap acceptance from matched scenarios, supporting cross-city generalizability assessment and simulation calibration
- Open-Source Toolkit: WayGraph Python toolkit with modules for scenario loading, topology analysis, fingerprinting, OSM matching, and traffic extraction
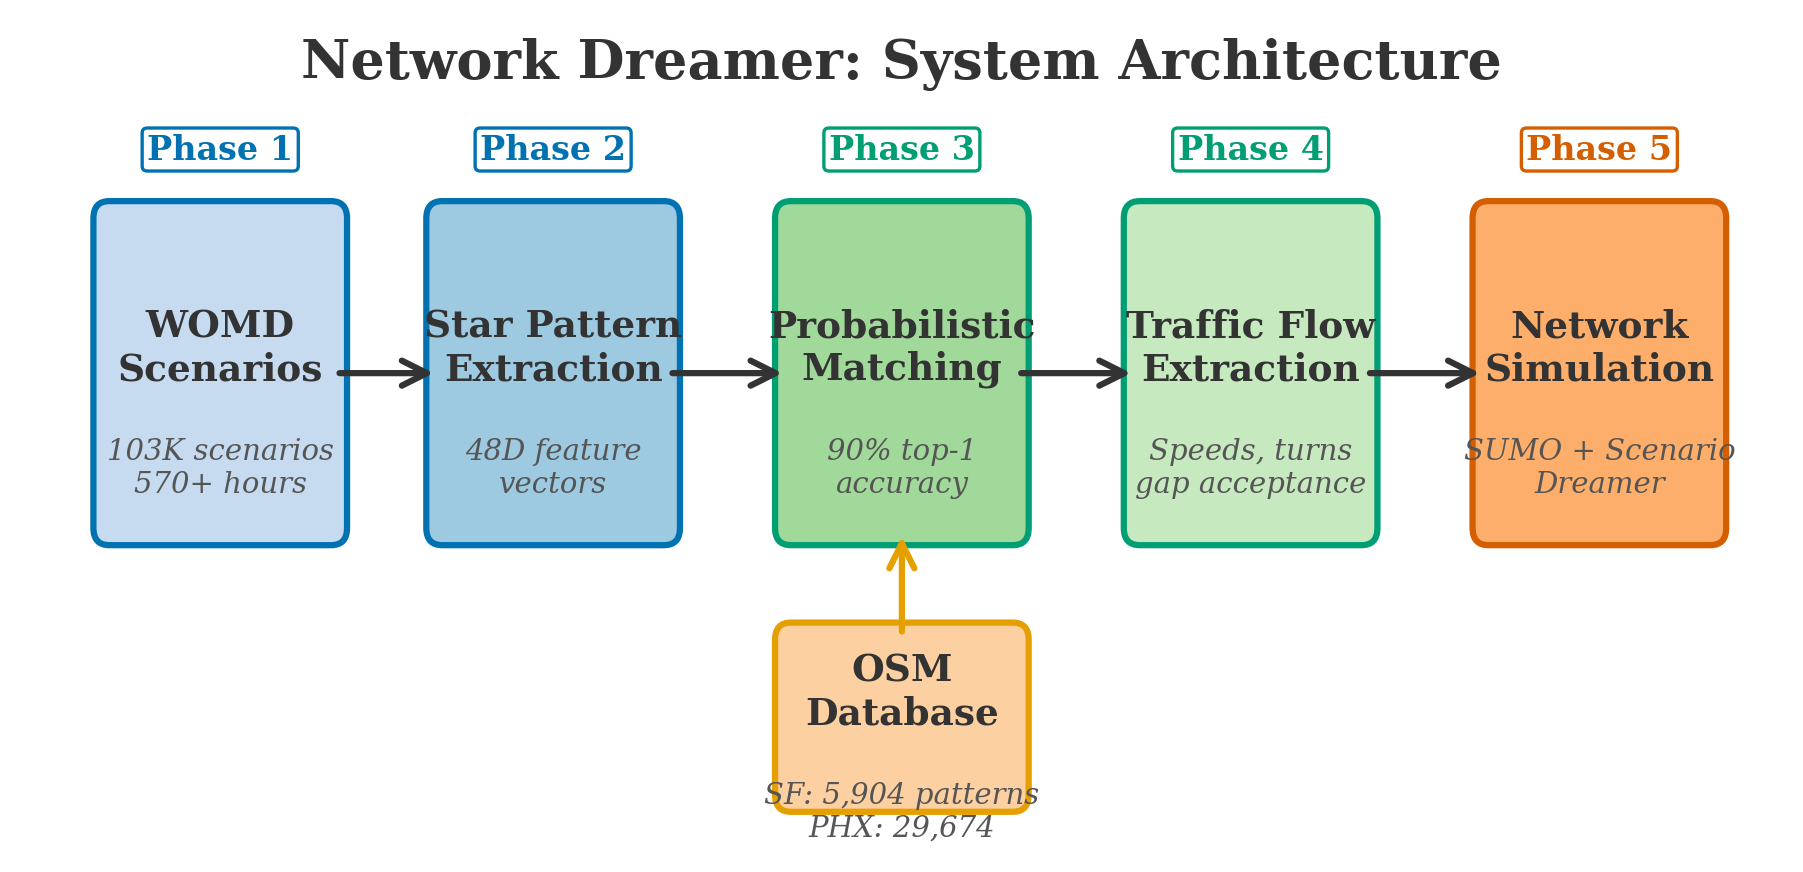
Pipeline Overview
WayGraph operates as a three-stage pipeline that transforms raw WOMD lane graphs into
geolocated intersection matches on OpenStreetMap. Each stage progressively refines the
search space, enabling efficient and accurate matching across thousands of candidate intersections.
Stage 1: Intersection Topology Extraction
Raw WOMD lane graphs contain hundreds of lane segments with complex connectivity.
We identify intersection centers by detecting lane convergence zones, then extract
the local topology: approach arms, lane counts per arm, traffic control types,
and connectivity between approaching and departing lanes.
Stage 2: Star Pattern Fingerprinting
Each intersection is encoded as a 48-dimensional feature vector capturing
both the center intersection properties (6 features) and its 1-hop neighborhood
(6 arms × 7 features per arm). This compact descriptor is rotation-invariant
and robust to geometric noise in the WOMD lane graphs.
Stage 3: Hierarchical Matching
Candidate OSM intersections are filtered hierarchically: first by approach count
(exact match), then by traffic control type, and finally by star pattern distance
(weighted Euclidean distance in 48D space). This reduces the search space from
5,904 candidates to a small shortlist before fine-grained matching.
Star Pattern Fingerprinting
The core innovation of WayGraph is the star pattern — a structured
48-dimensional vector that captures the topological fingerprint of an intersection and
its immediate neighborhood. The name derives from the star-shaped pattern formed by
the intersection center and its radiating approach arms.
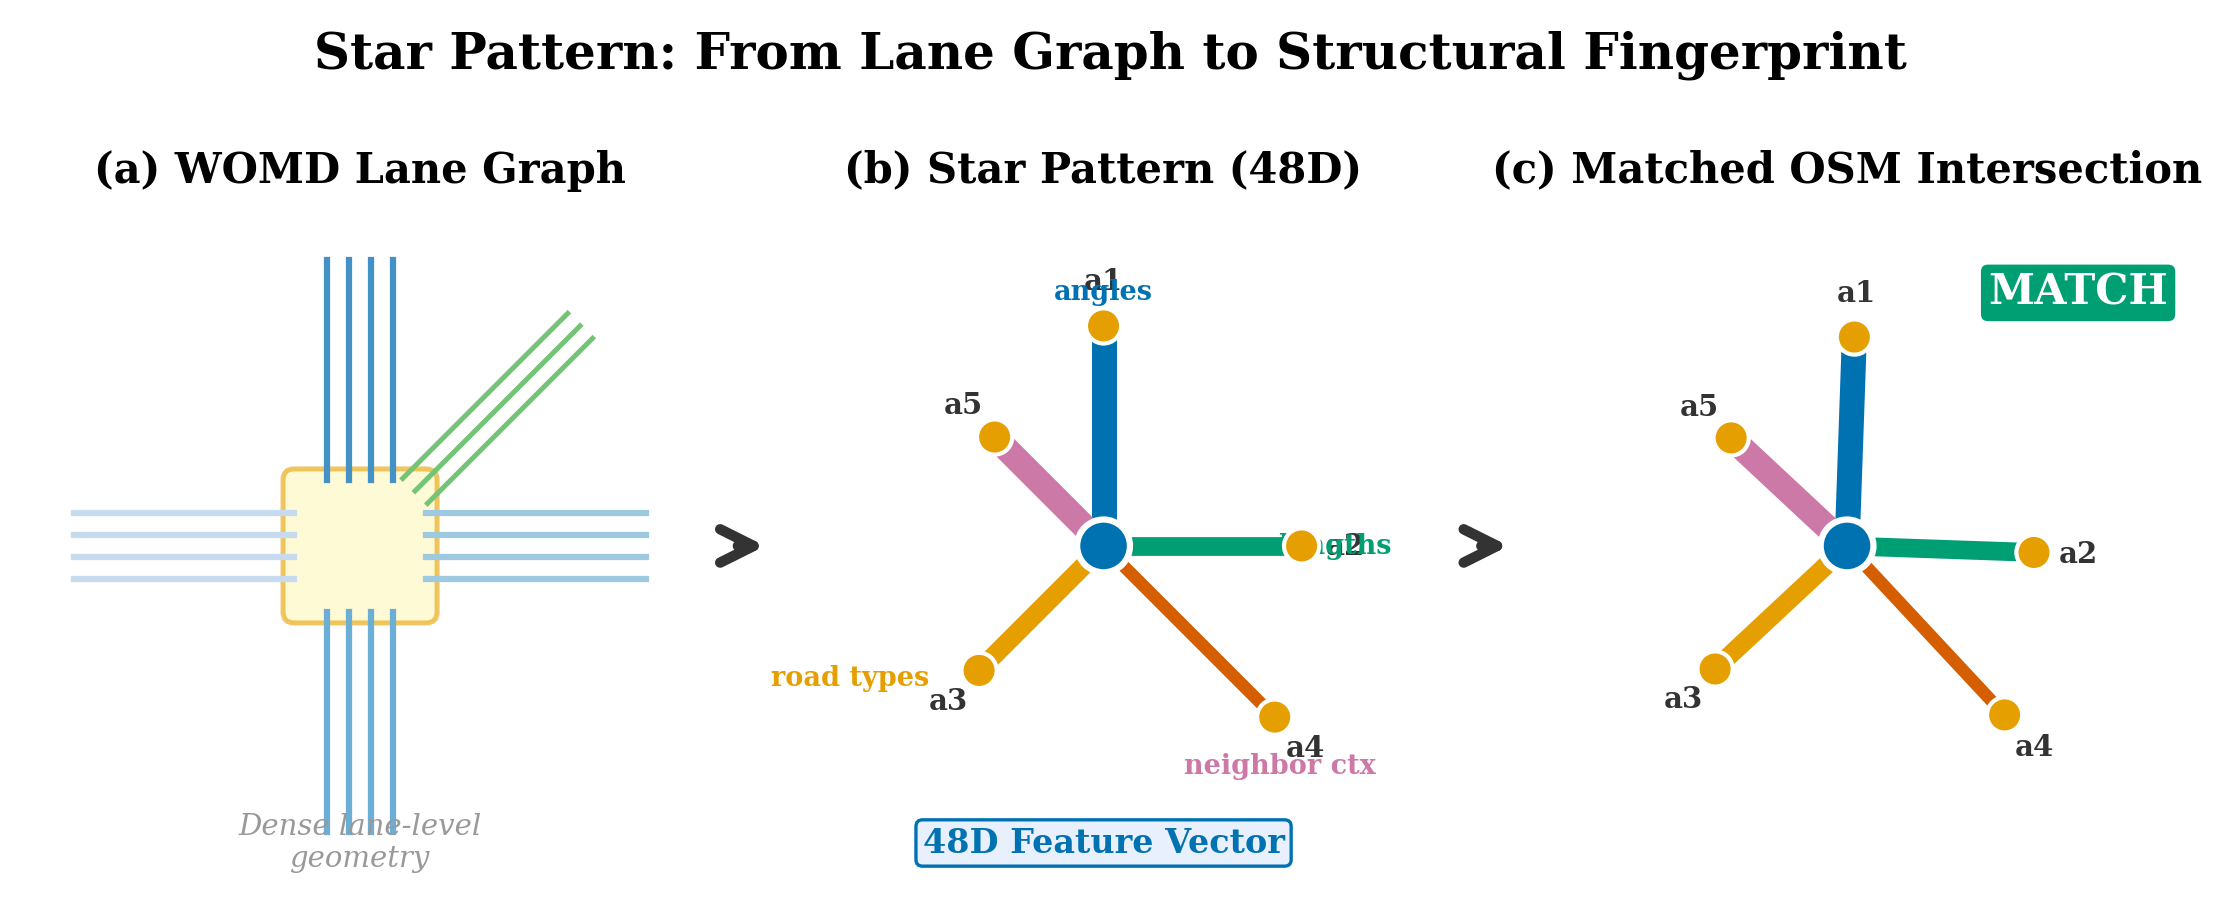
Star pattern concept: center intersection (hub) with radiating approach arms forming a star topology
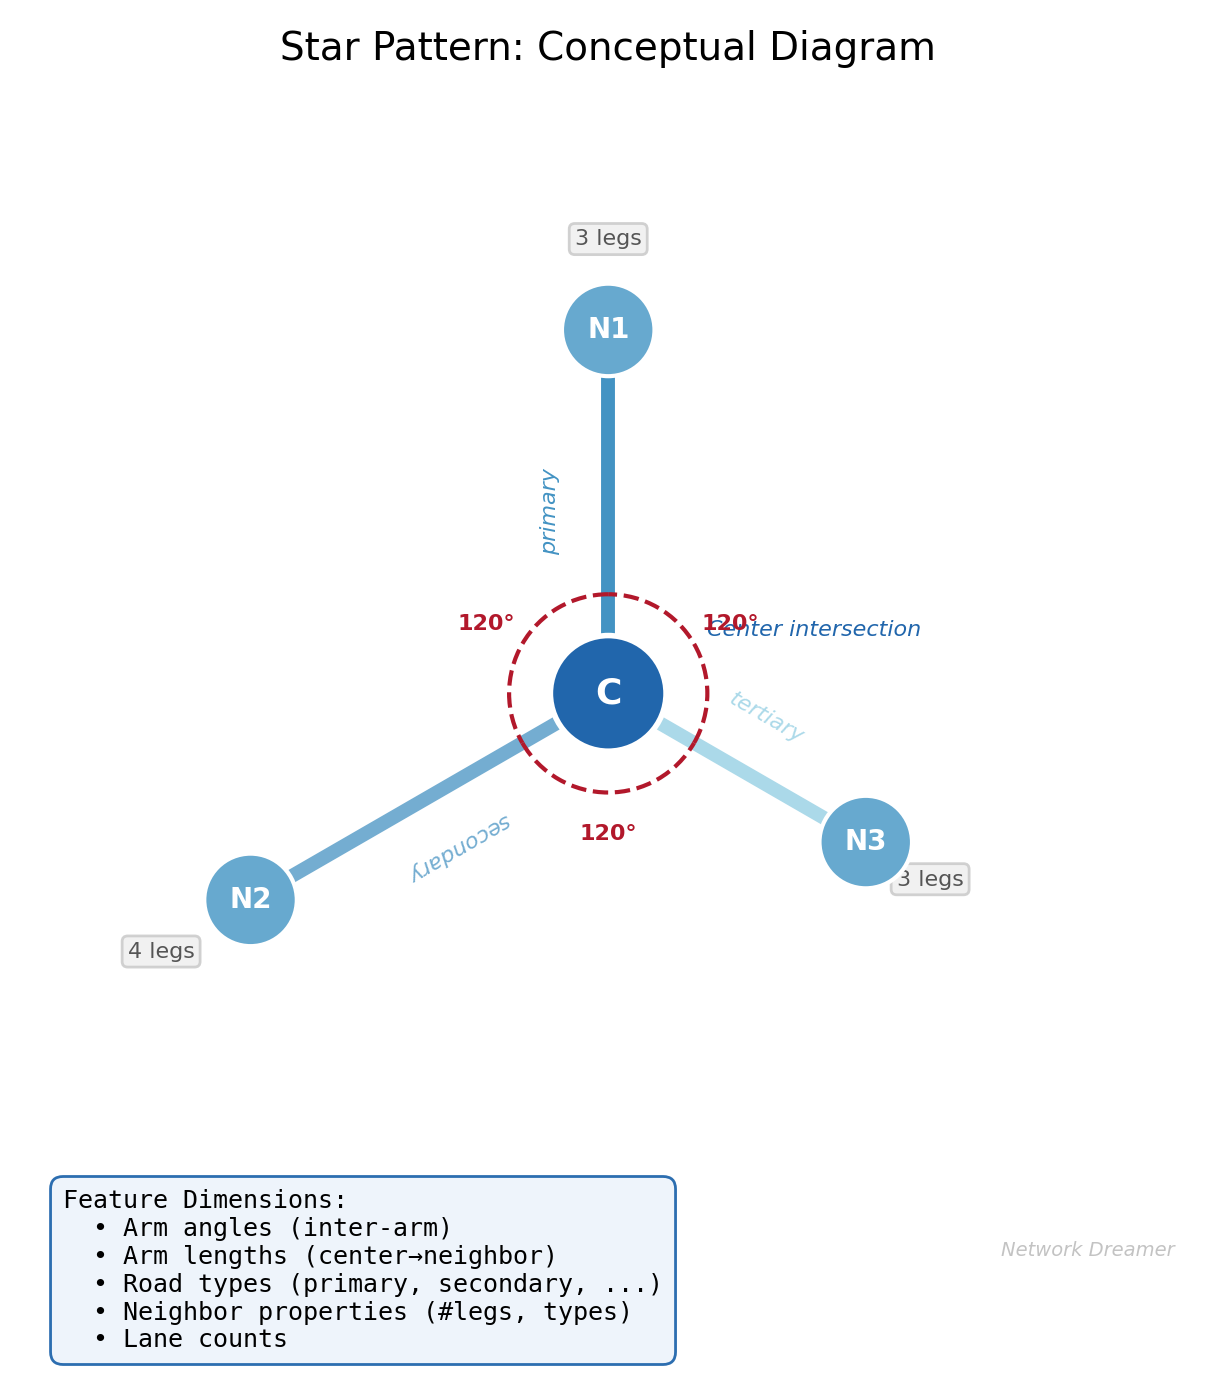
48D feature vector encoding: 6 center features + 6 arms with 7 features each
Feature Vector Breakdown
Center Features (6D)
Intersection type (signalized, stop-controlled, uncontrolled)
Number of approaches (3-way, 4-way, 5+ way)
Total lane count across all arms
Traffic control configuration
Symmetry indicators
Connectivity density
Per-Arm Features (7D × 6 arms = 42D)
Approach direction (angular encoding)
Road type (arterial, collector, local)
Inbound lane count
Outbound lane count
Traffic control at arm (signal phase, stop sign)
Speed limit category
Neighbor intersection distance and type
Why 48 dimensions? The star pattern balances expressiveness with robustness.
With 6 arms (padded with zeros for intersections with fewer approaches), the vector captures
enough detail to distinguish similar-looking intersections while remaining tolerant of the
±10° approach angle noise and ±1 lane count discrepancies commonly found
in WOMD lane graphs.
Animated Demonstrations
Geographic coverage building: OSM network → intersection matching → corridor coverage
Key result figures: matching accuracy, ablation study, noise robustness
Safety analysis: crash overlay → tier comparison → crash types
Satellite validation: 10 randomly selected scenarios verified against imagery
Revealing Training Data Coverage at Scale
WayGraph maps 70,541 Waymo scenarios onto real-world OpenStreetMap intersections
using only lane graph topology — no GPS coordinates,
no satellite imagery, no visual features. This reveals which intersection types
the dataset covers and where geographic blind spots may limit model generalizability.
Matching Results
We evaluate the matching pipeline on San Francisco scenarios from the Waymo Open Motion Dataset,
where ground-truth intersection locations are available for validation. The hierarchical
filtering strategy progressively narrows candidates before computing star pattern distances.
Key Results
90%
Top-1 accuracy
correct match ranked first
97%
Top-5 accuracy
correct match in top 5
±10°
Approach angle tolerance
robust to WOMD noise
±1
Lane count tolerance
handles mapping errors
Hierarchical Filtering Strategy
Step 1 — Approach Count Filter: Eliminate all OSM intersections with a
different number of approaches (e.g., 3-way vs 4-way). This alone reduces candidates by ~60%.
Step 2 — Traffic Control Filter: Match traffic control configurations
(signalized vs stop-controlled). Reduces remaining candidates by ~50%.
Step 3 — Star Pattern Distance: Compute weighted Euclidean distance
in 48D space between the query and remaining candidates. Rank by distance and return top-K matches.
Robustness: The matching pipeline is robust to common WOMD artifacts including
noisy approach angles (±10°), inconsistent lane counts (±1 lane),
and missing or extra lane segments at intersection boundaries. The hierarchical filtering
ensures that even when individual features are noisy, the overall pattern match remains reliable.
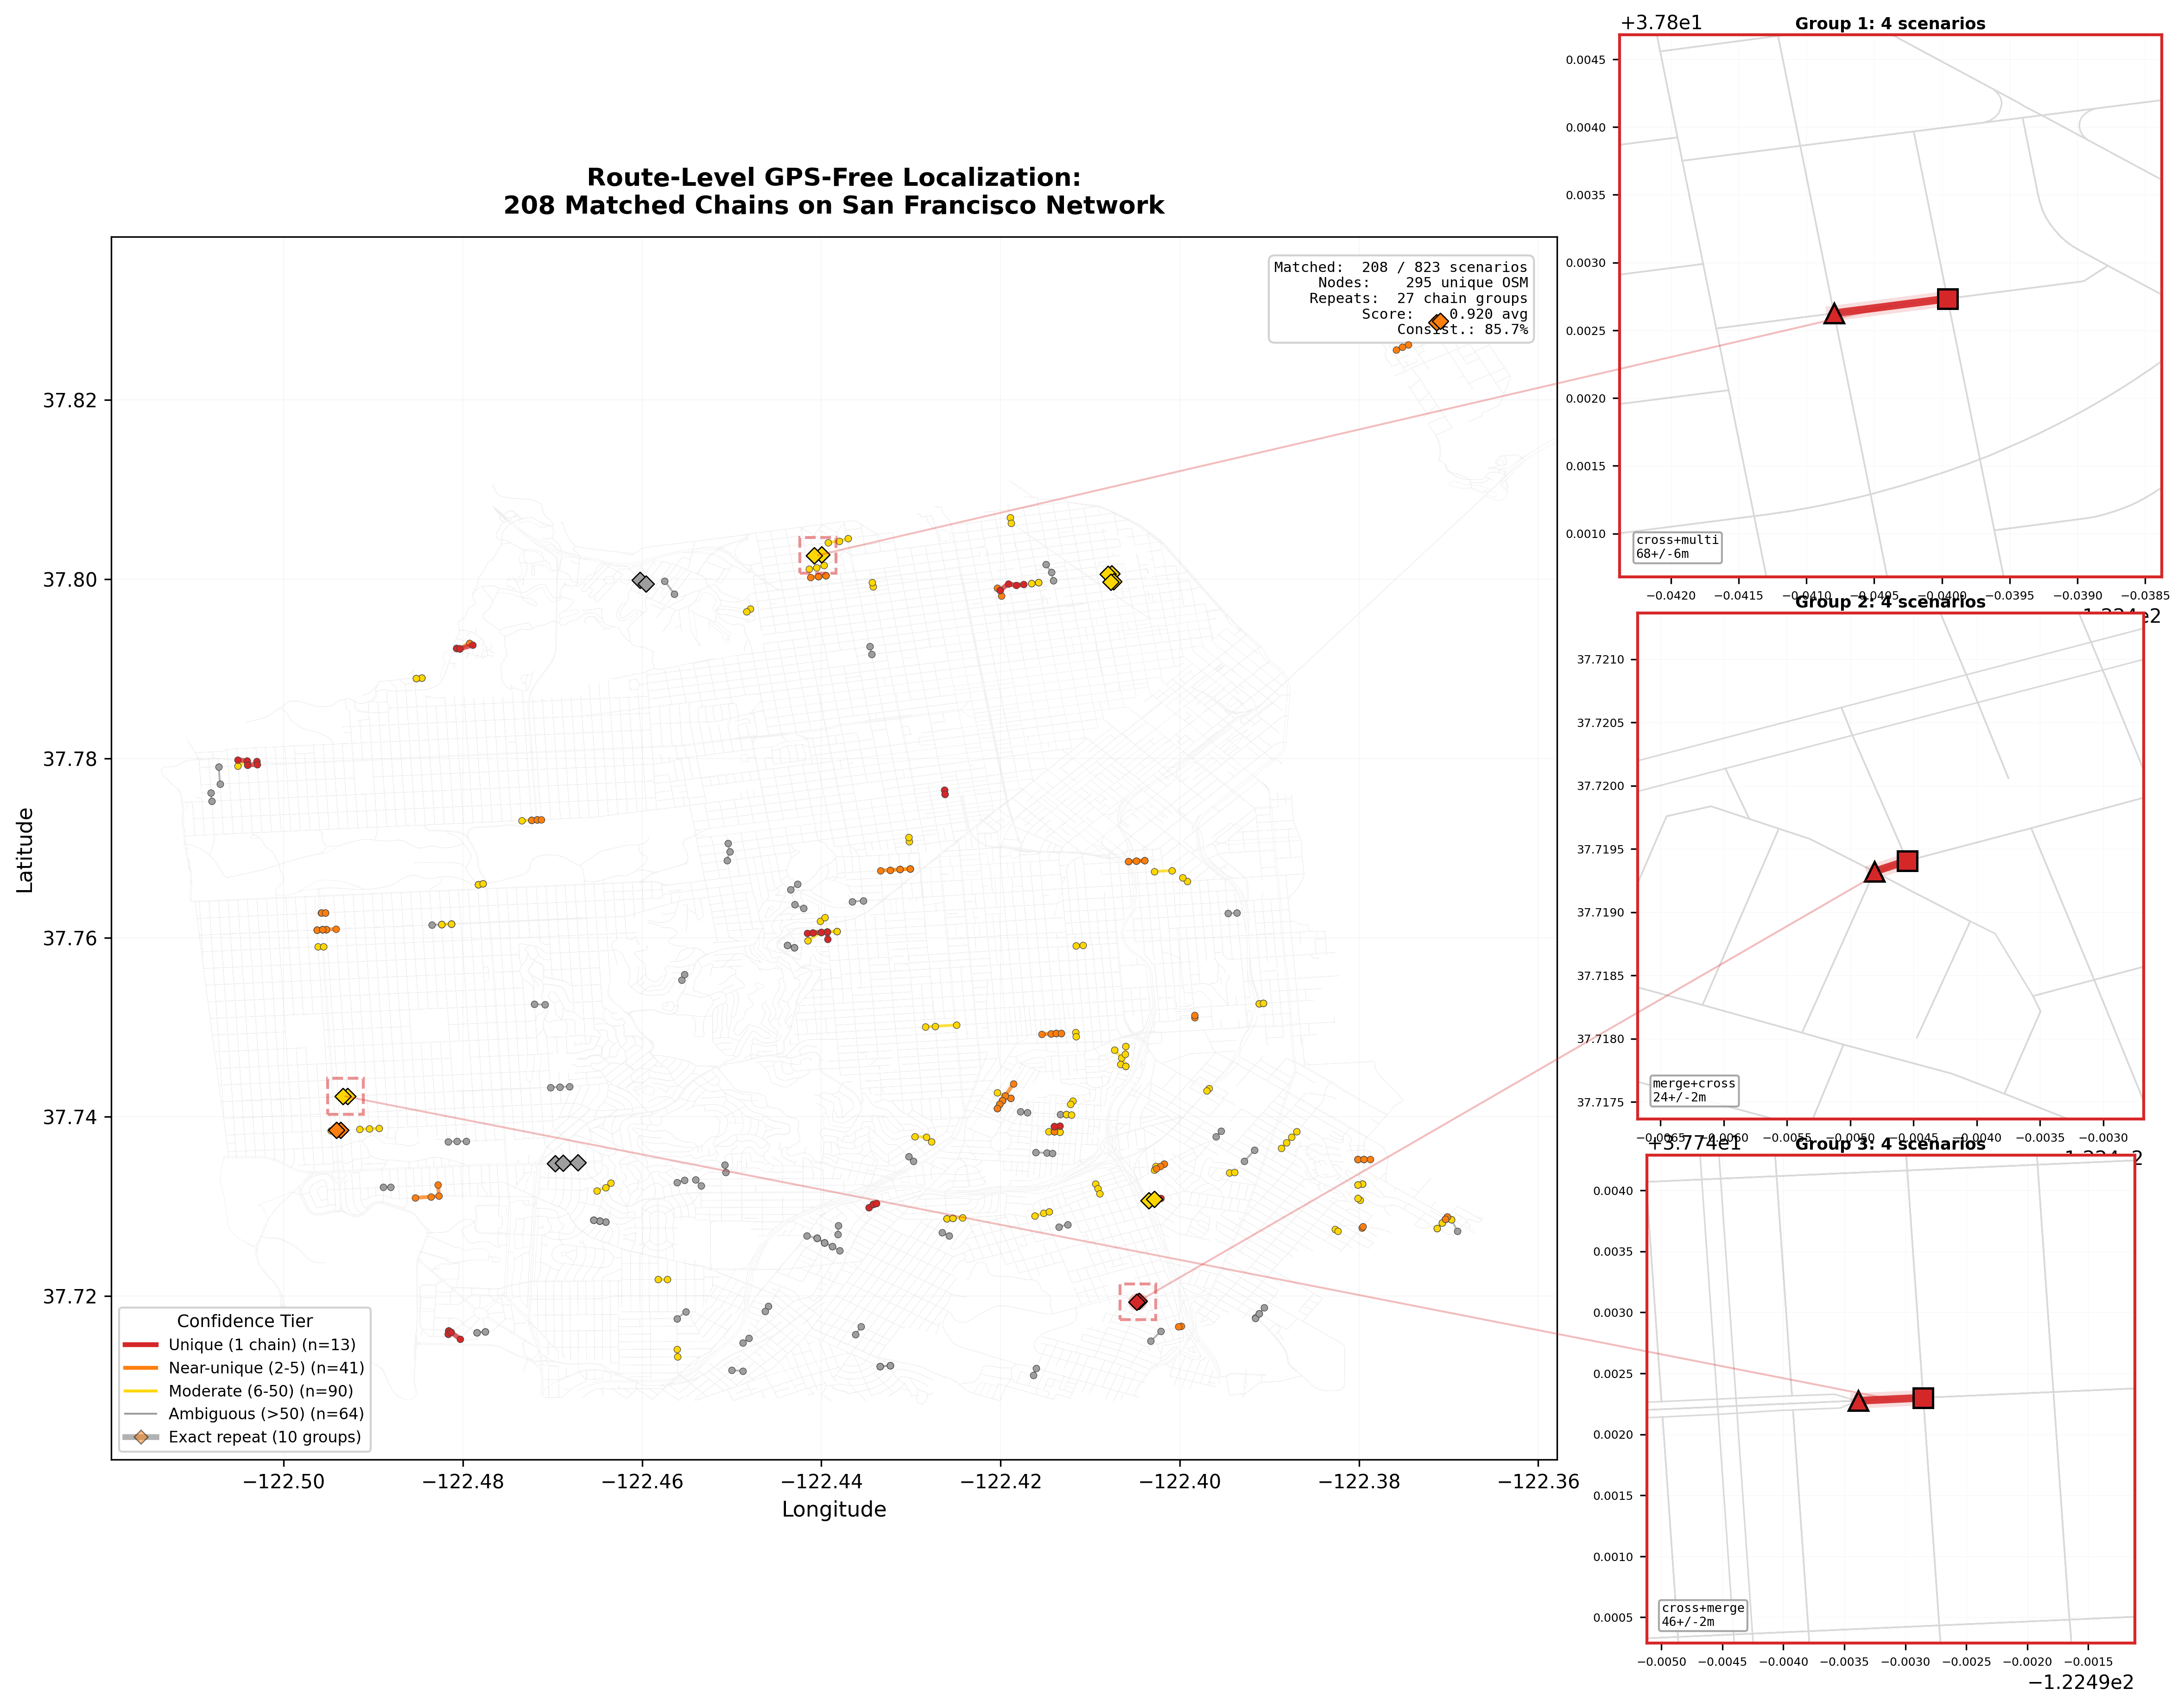
Route-Level Matching
Beyond intersection-level matching, WayGraph performs route-level localization by matching complete driving routes across consecutive scenarios. This validates geographic accuracy through spatial consistency of matched sequences.
51.9%
Route-level match rate
across 70,541 scenarios
17,645
Matched routes
with inter-distance constraints
1,597
Chain repeats
sub-2-meter consistency
100%
Spatial accuracy
50 satellite-validated scenarios
Geographic validation: 1,597 chain repeats — cases where different scenarios independently match to the same route — provide strong evidence of matching accuracy. These chains show sub-2-meter spatial consistency, confirming that the star pattern fingerprinting captures genuine geographic identity.
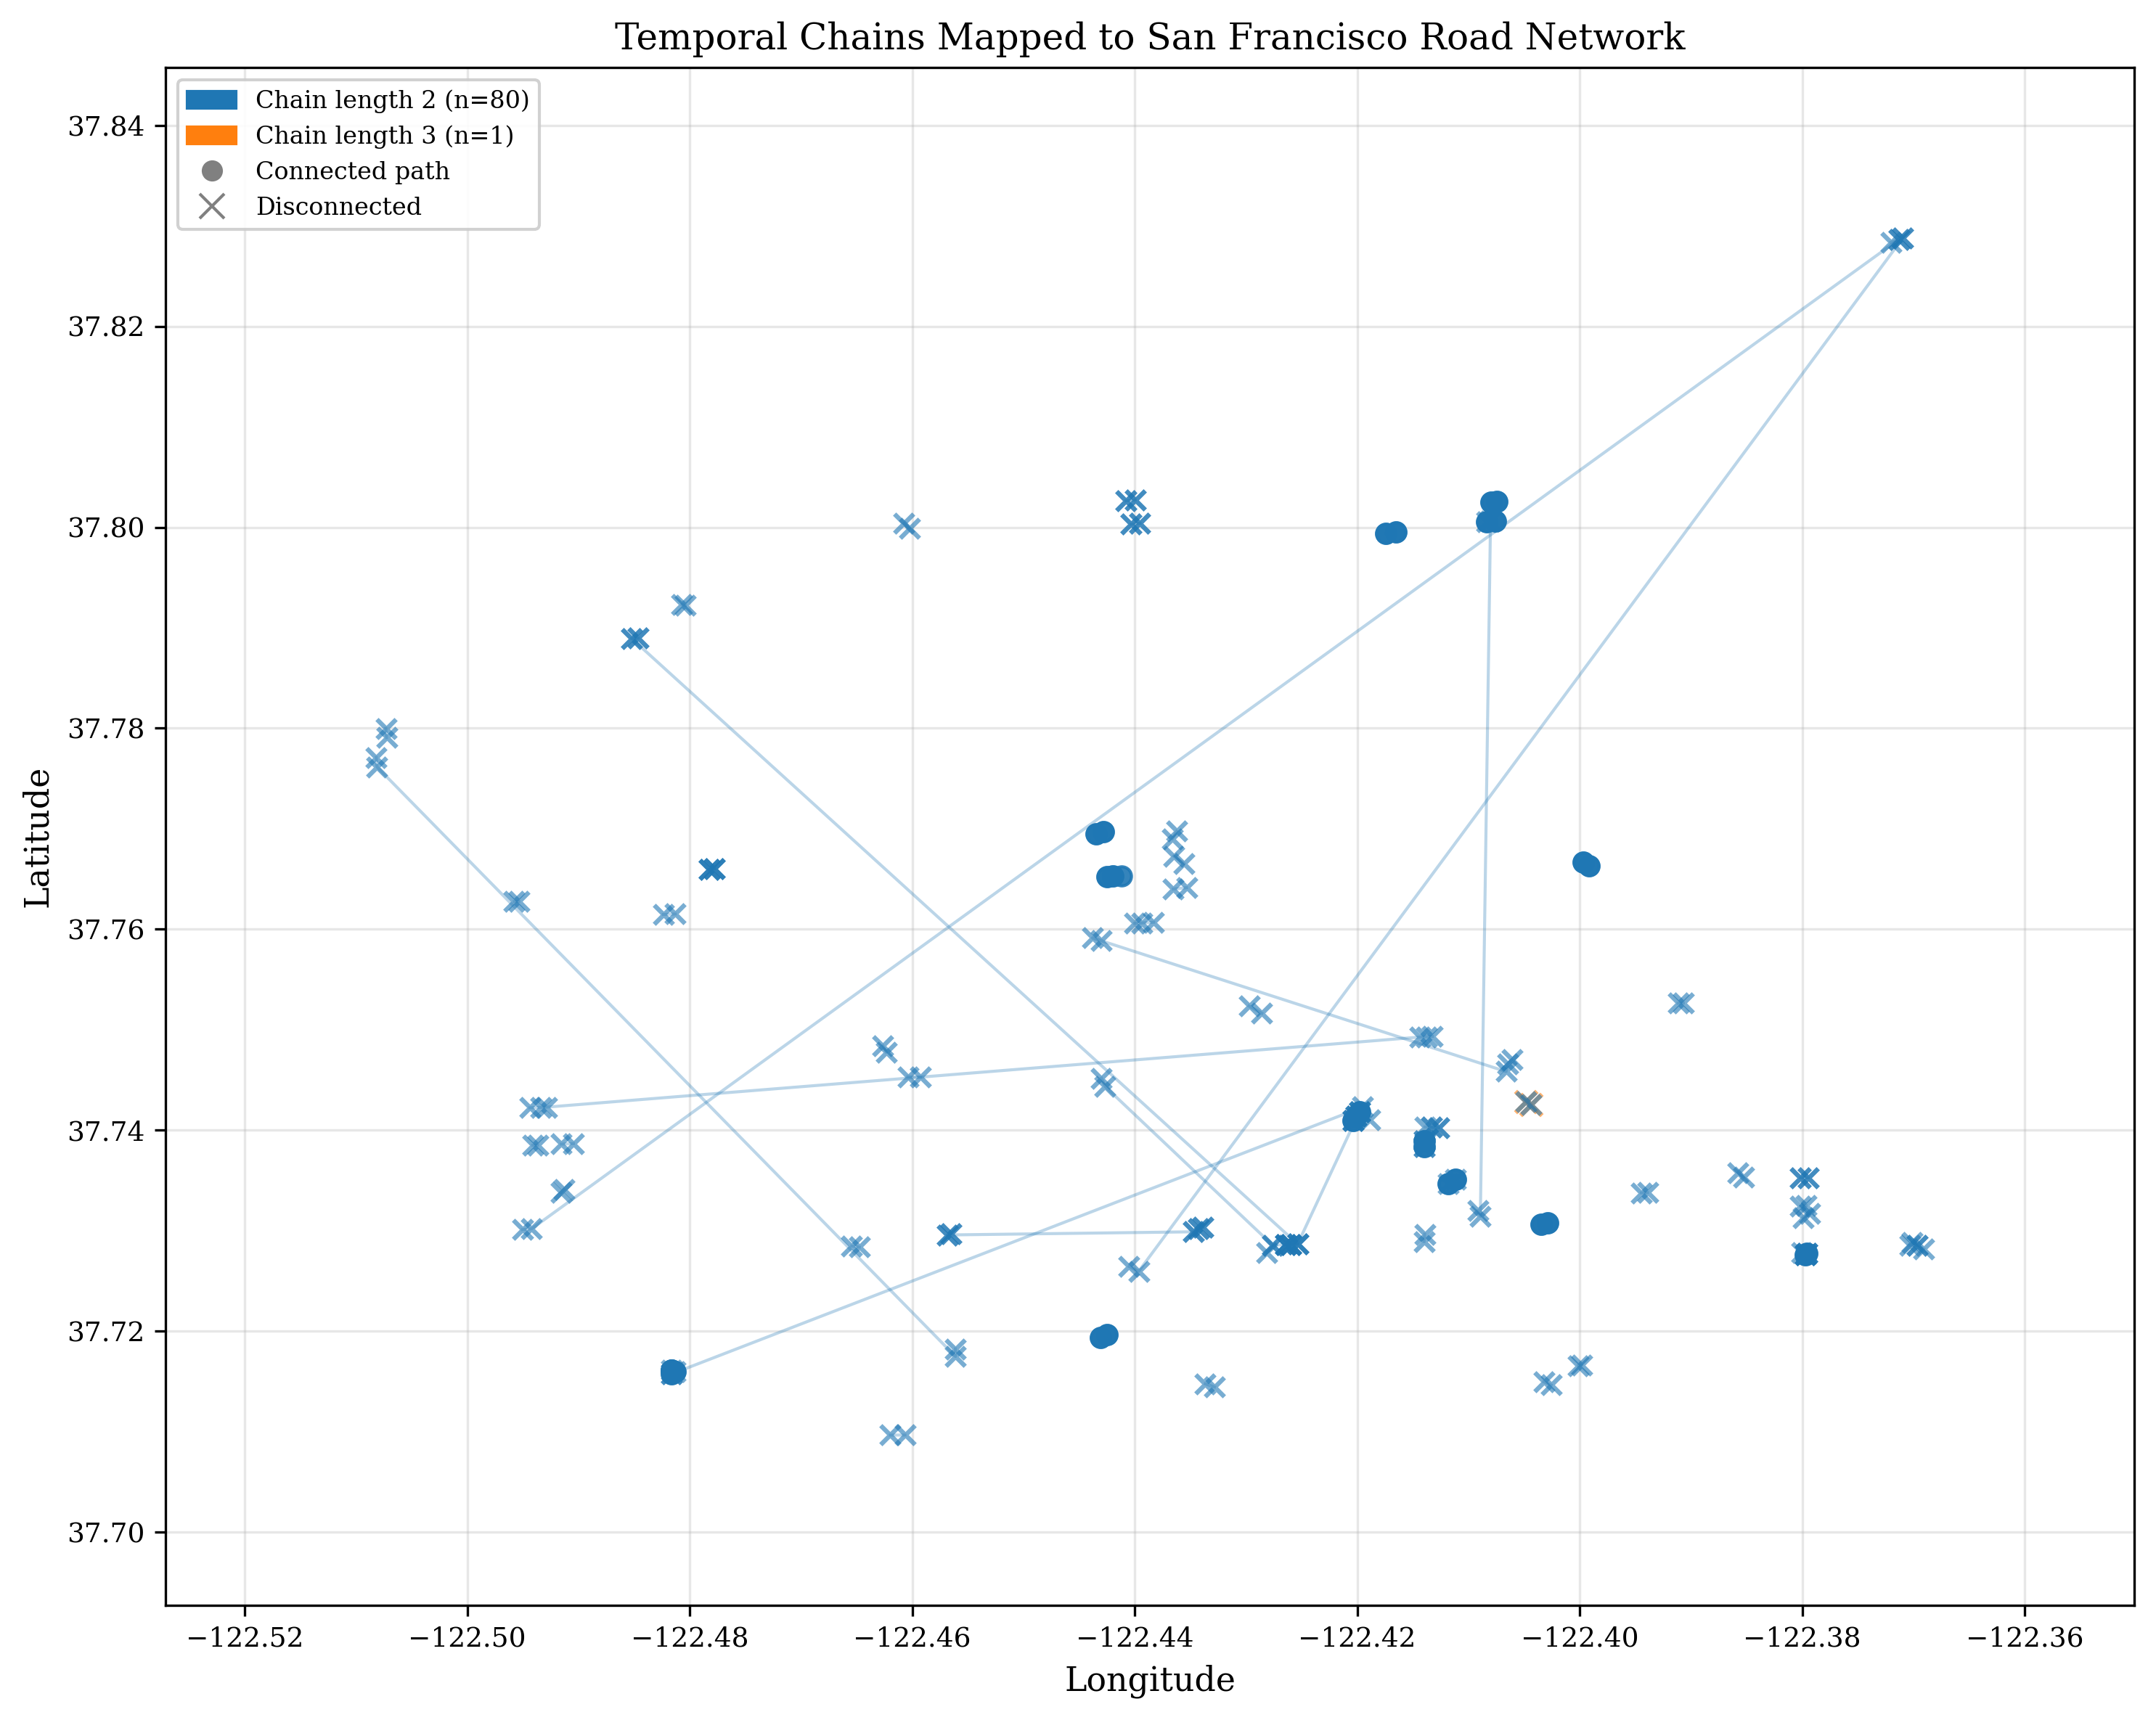
Temporal Continuity Validation
Waymo extracts overlapping 9.1-second sliding windows from continuous recording drives.
We discovered that scenarios within each shard share a global coordinate frame — meaning
hundreds of these short clips can be chained back into continuous driving sequences,
each lasting 13–18 seconds. Across 252 shards, we found 483 temporal connections
linking 369 chains, with ego positions aligning to sub-centimeter precision in overlap regions.
This is the key enabler for corridor-level traffic analysis: instead of treating each 9.1s scenario
as an isolated snapshot, we can reconstruct extended driving trajectories along real road segments.
It also provides powerful independent validation of our star pattern matching — if temporally
consecutive scenarios independently match to adjacent OSM intersections, the geographic localization is correct.
483
Overlapping 9.1s windows
chained into continuous drives
0.006m
Ego alignment error
between consecutive scenes
31.2
Vehicles matched per overlap
confirming shared physical context
56%
Chains map to connected OSM paths
vs 3.9% random (p<0.001)
Why this matters:
Single 9.1s scenario → chain overlapping windows into 13–18s continuous drives →
star pattern localization onto OSM → aggregate multiple drives on the same corridor →
network-level traffic parameter estimation.
This upgrades WayGraph from scenario-level positioning to validated network reconstruction.
The 56% path connectivity (vs 3.9% baseline, Cohen's d = 13.5) confirms that our matching
recovers genuine geographic trajectories from anonymized data.
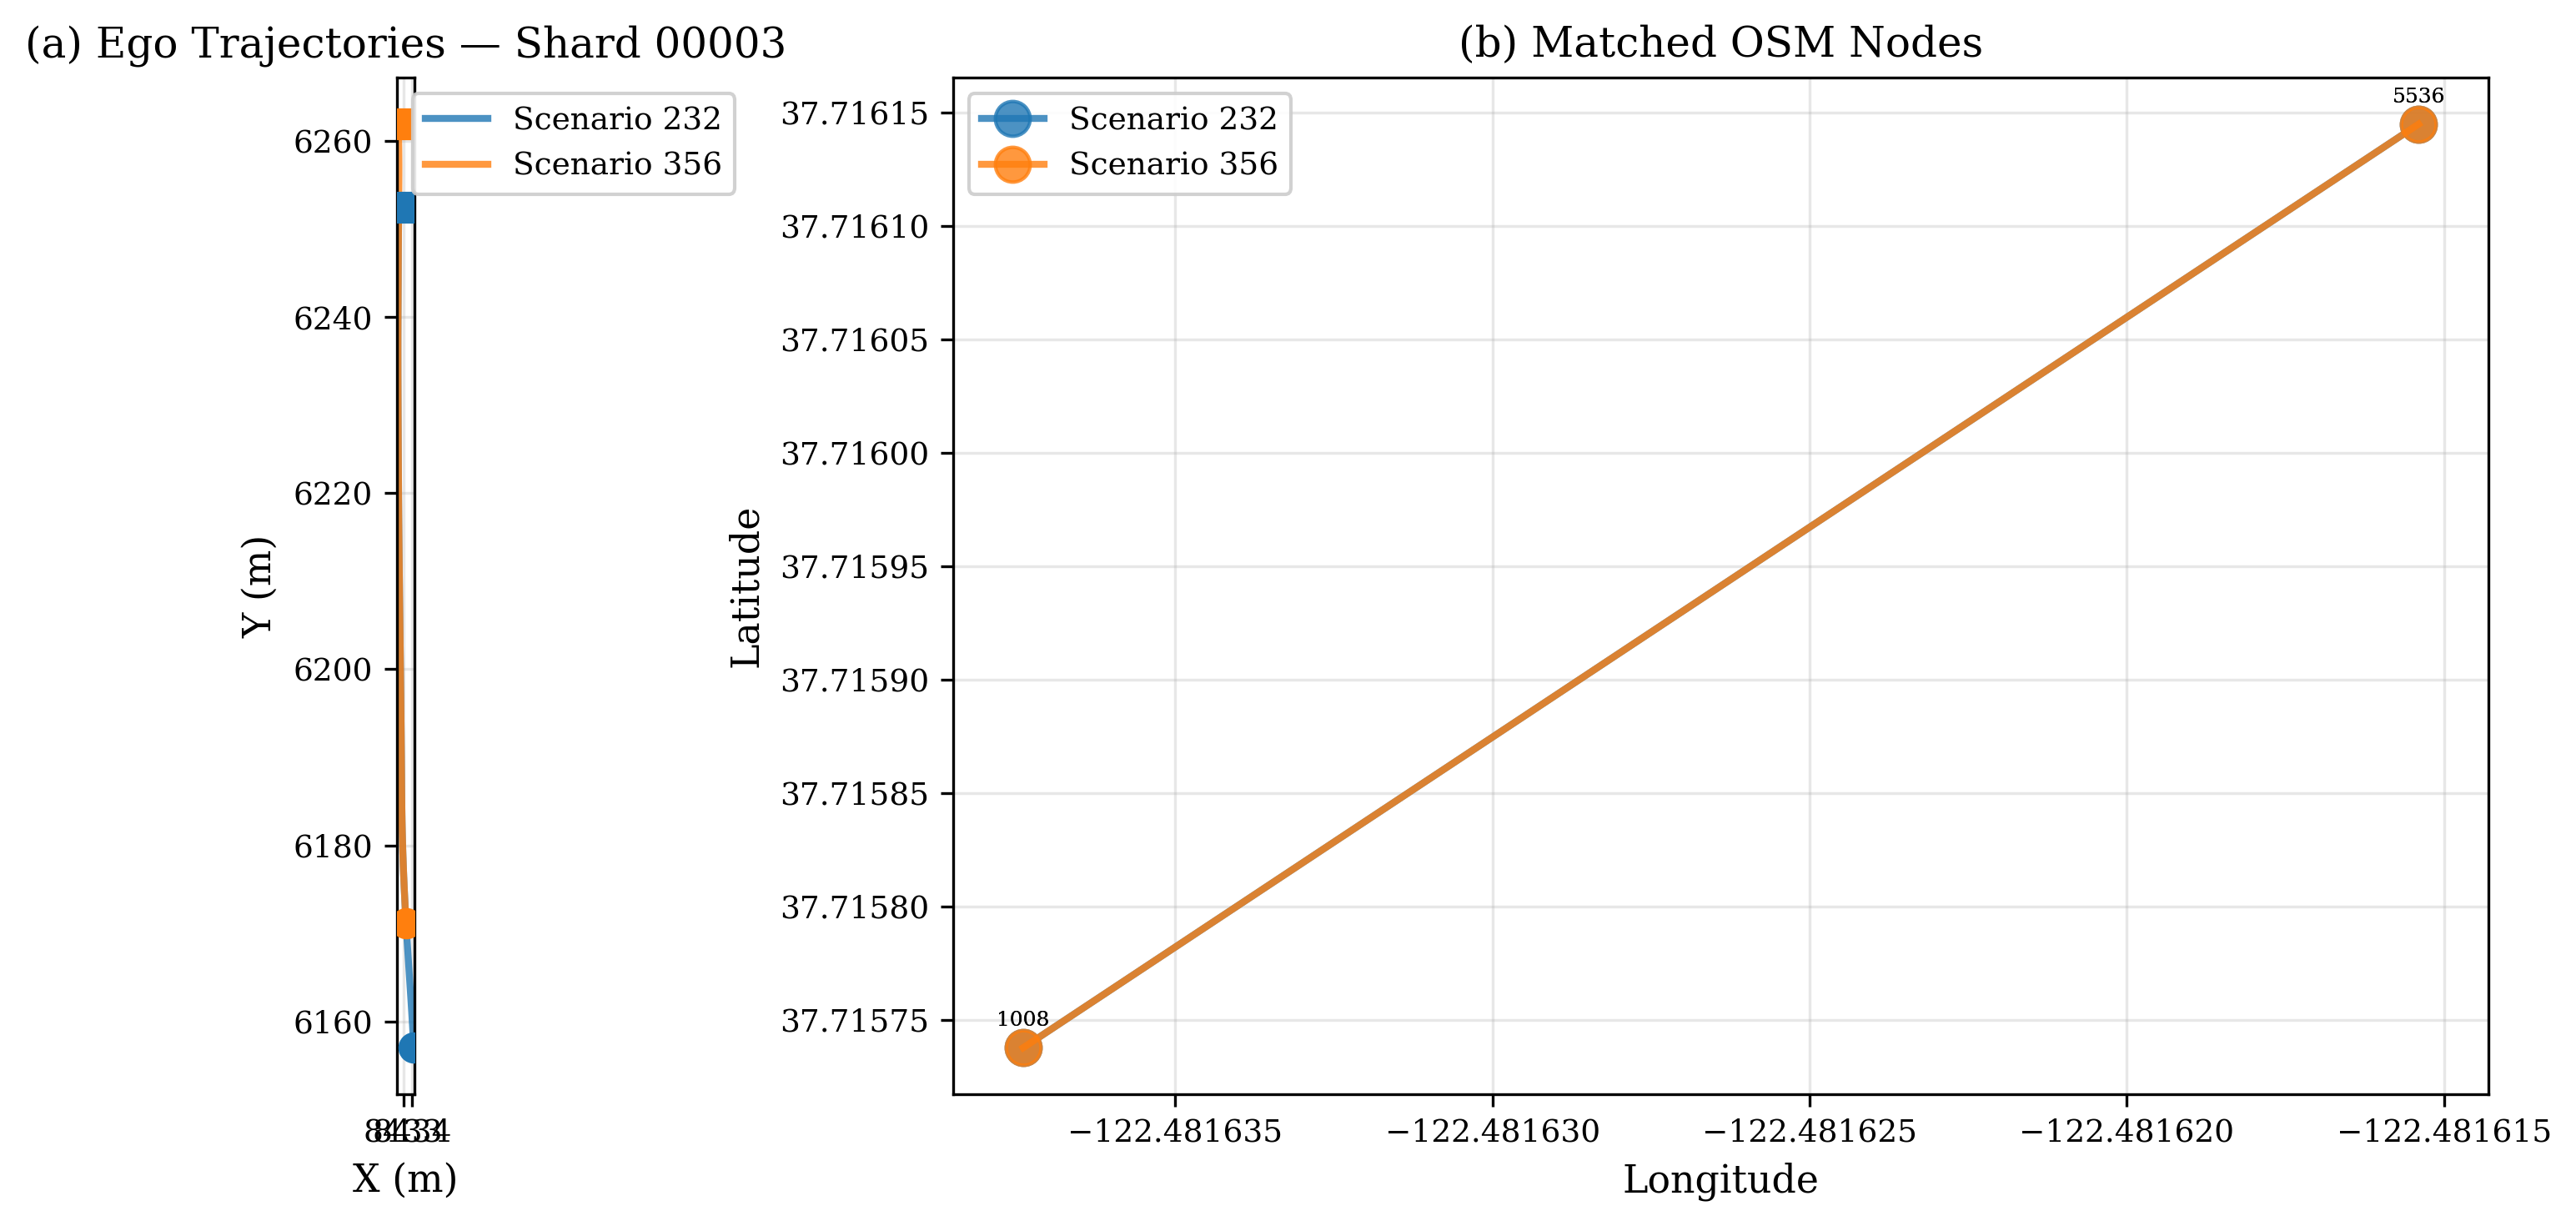
Temporal chain: overlapping ego trajectories linked across consecutive scenarios
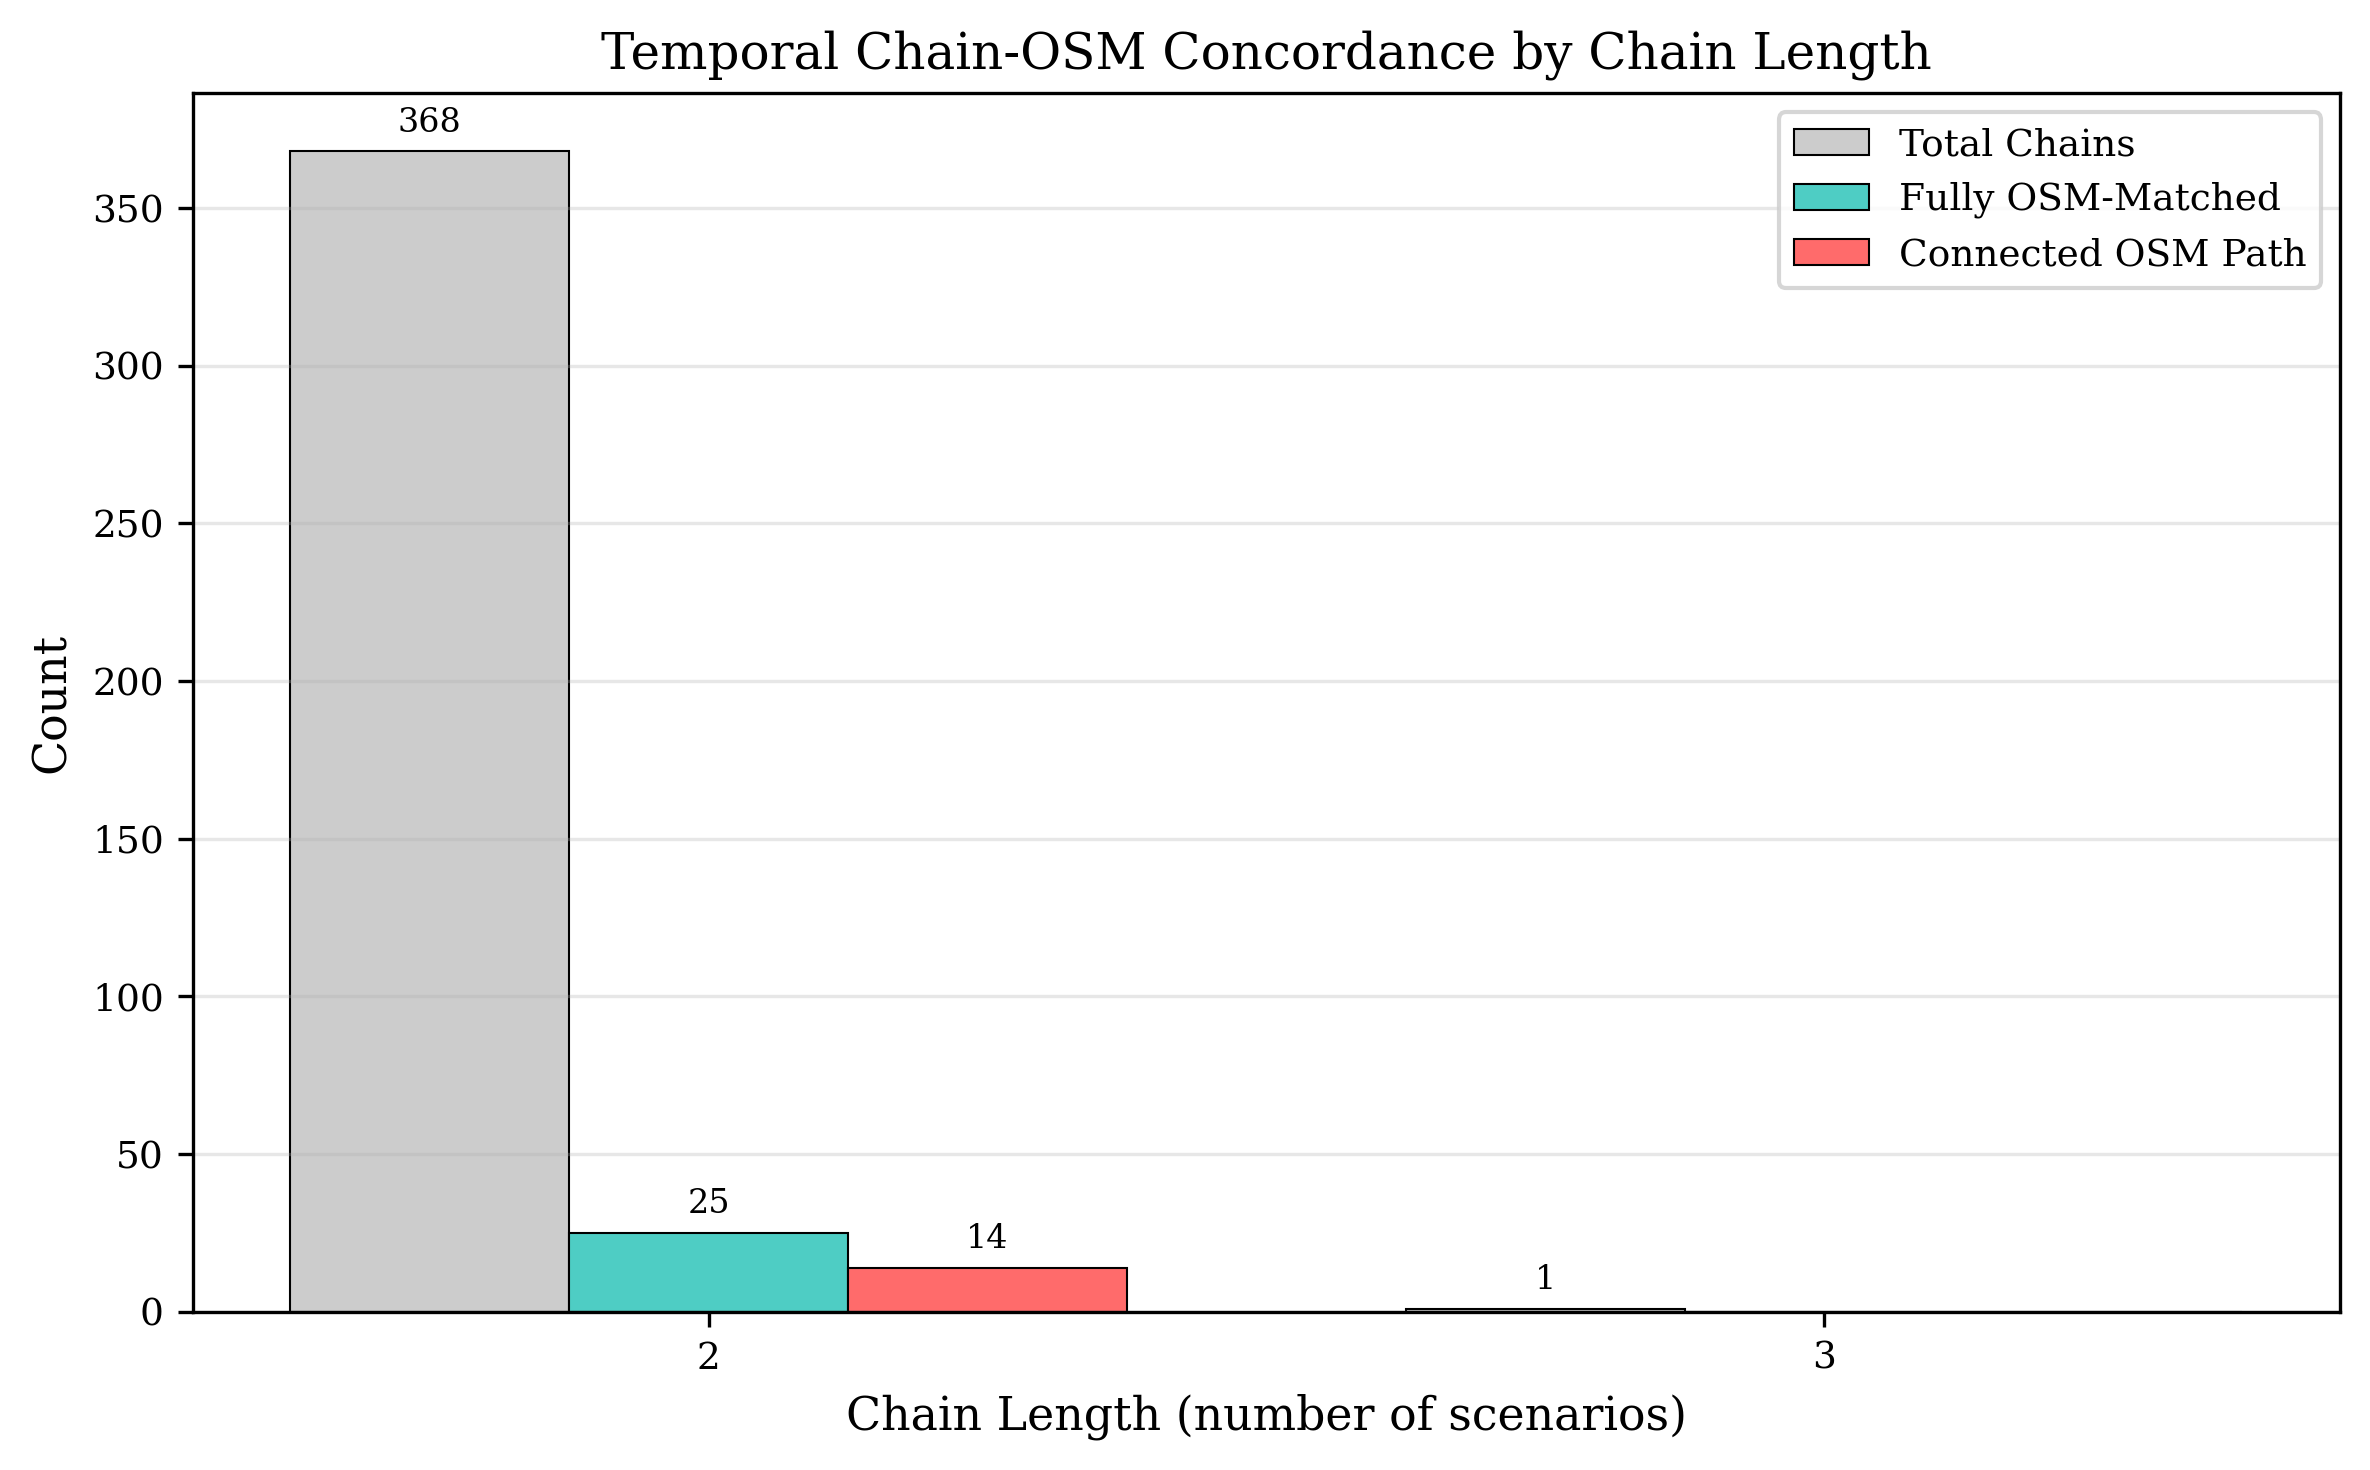
Cross-validation: chain connectivity vs random baseline (p < 0.001)
Interactive Temporal Visualization
Each tab is a pair of overlapping 9.1s scenarios from the same continuous drive.
Orange = Scene A, Blue = Scene B, Green = overlap region where both scenes observe the same physical space.
Drag to pan, scroll to zoom.
Corridor-Level Traffic Analysis
Matched routes enable aggregation of traffic data at the corridor level, providing travel time reliability metrics and identifying speed transition zones across the road network.
990
Reliable road segments
187.4 km total coverage
1.24
Travel Time Index
(TTI, corridor average)
28
Severe deceleration zones
identified from speed profiles
1,400
Unique OSM nodes
covered by matched routes
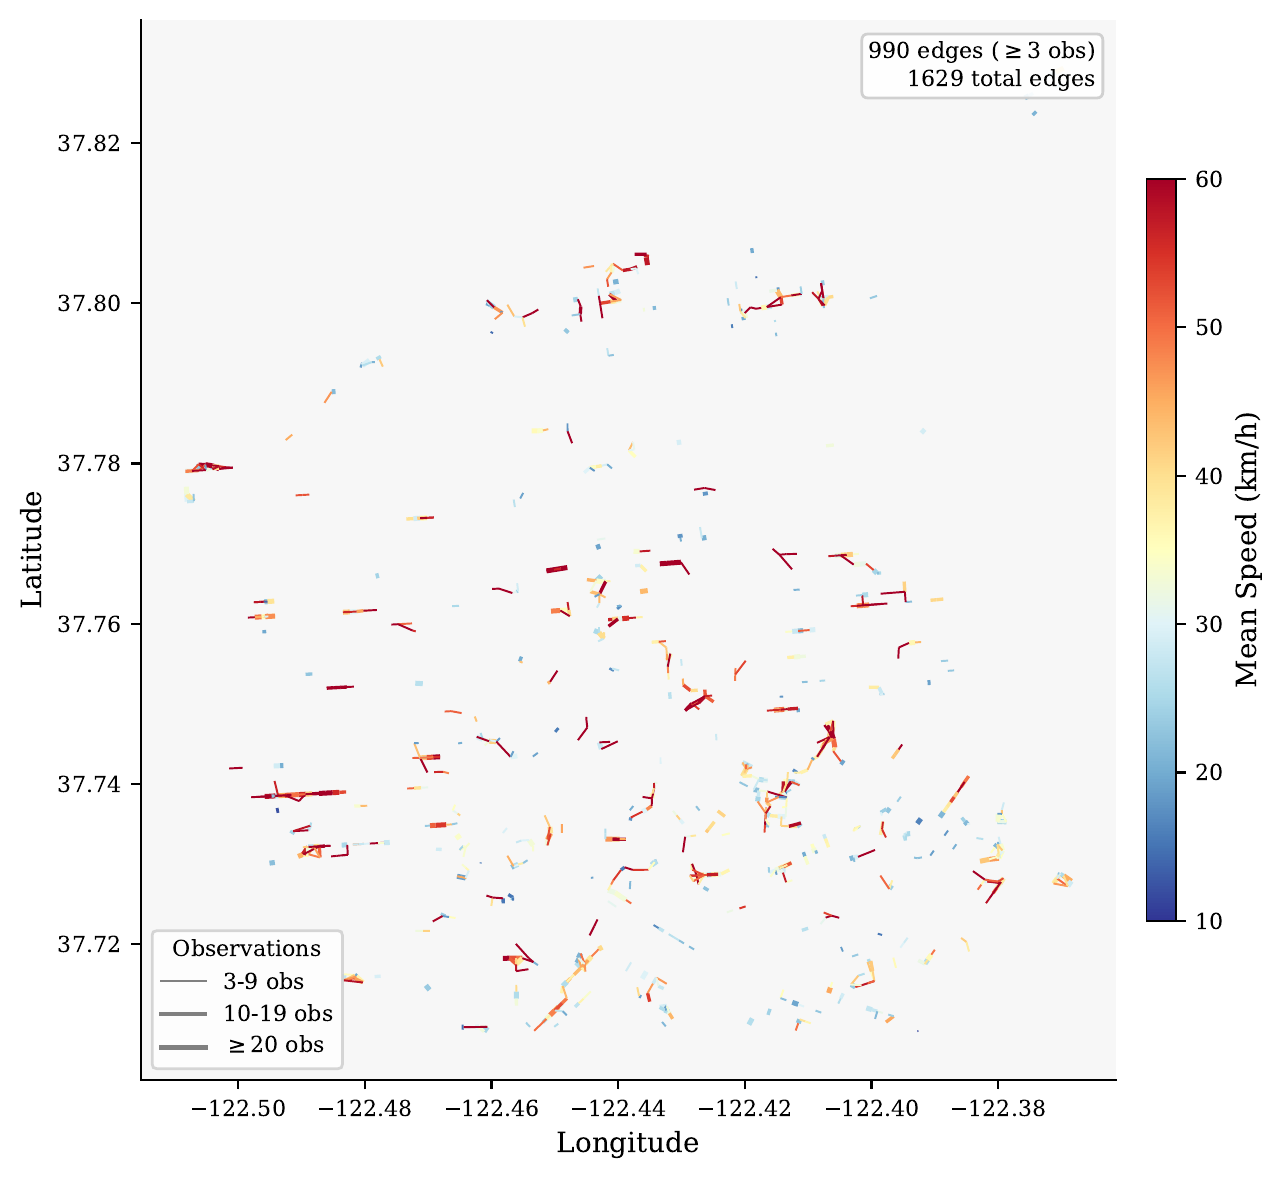
Corridor speed map showing average speeds across matched road segments
Travel time distributions: TTI=1.24, BTI=0.35, PTI=1.71
Safety Analysis
By joining matched intersections with historical crash records, WayGraph enables safety analysis of the scenarios represented in the Waymo dataset, revealing systematic sampling biases.
2,161
Intersections joined
with 63,977 crash records
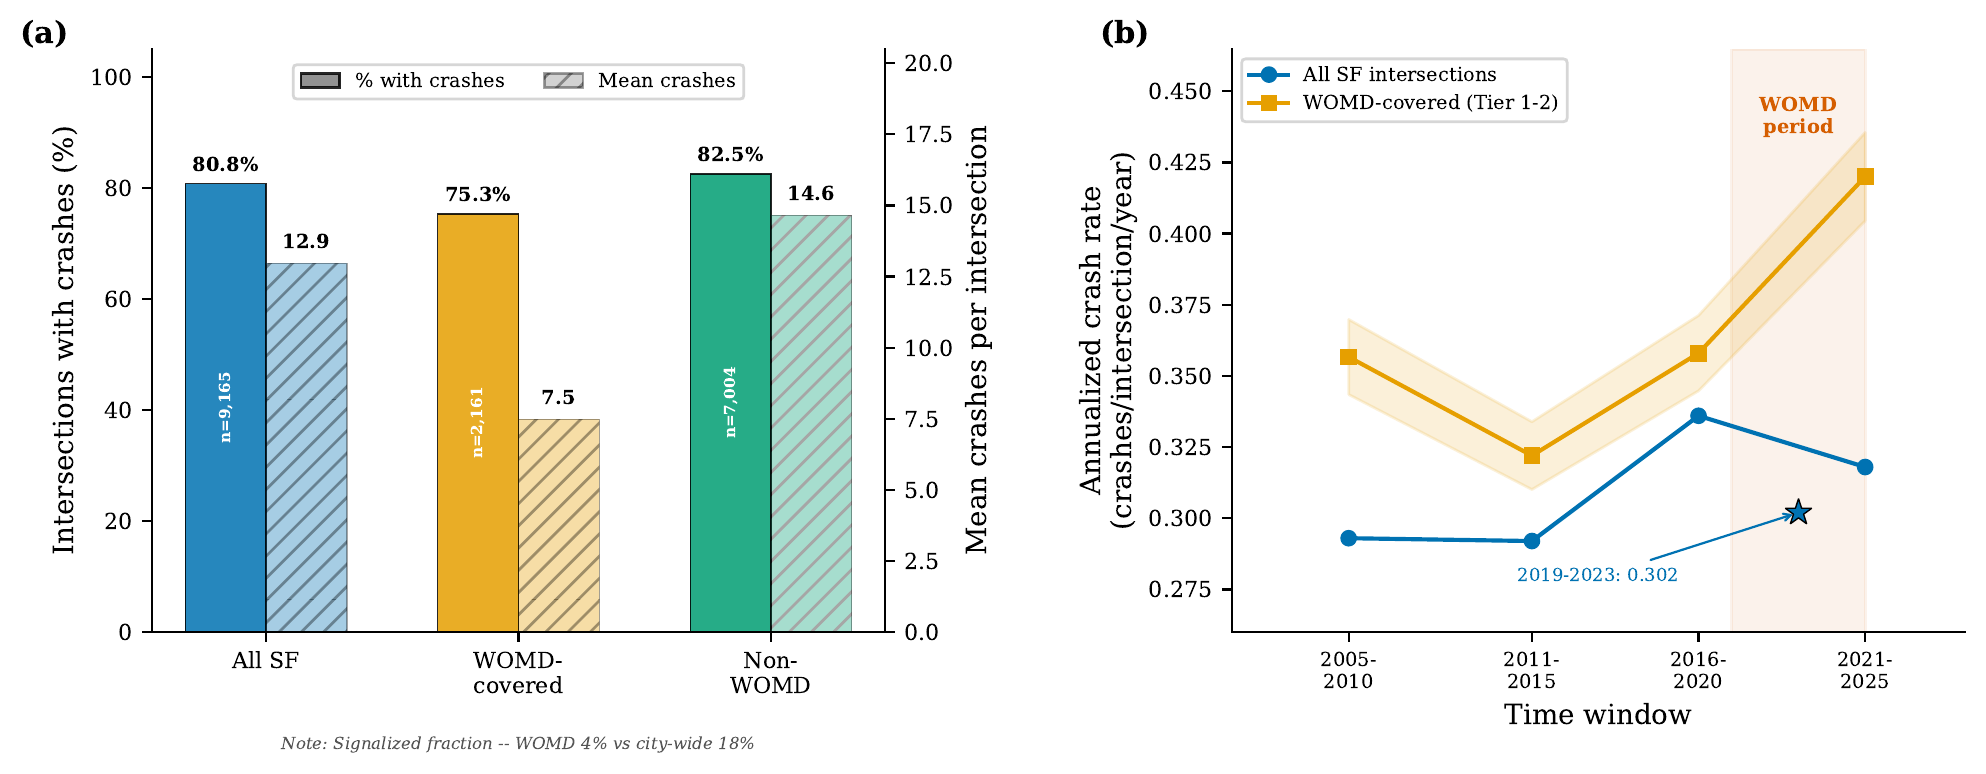
75.3%
Have nearby crashes
(vs 80.8% city-wide base rate)
4.3%
Signalized in WOMD
(vs 17.8% city-wide)
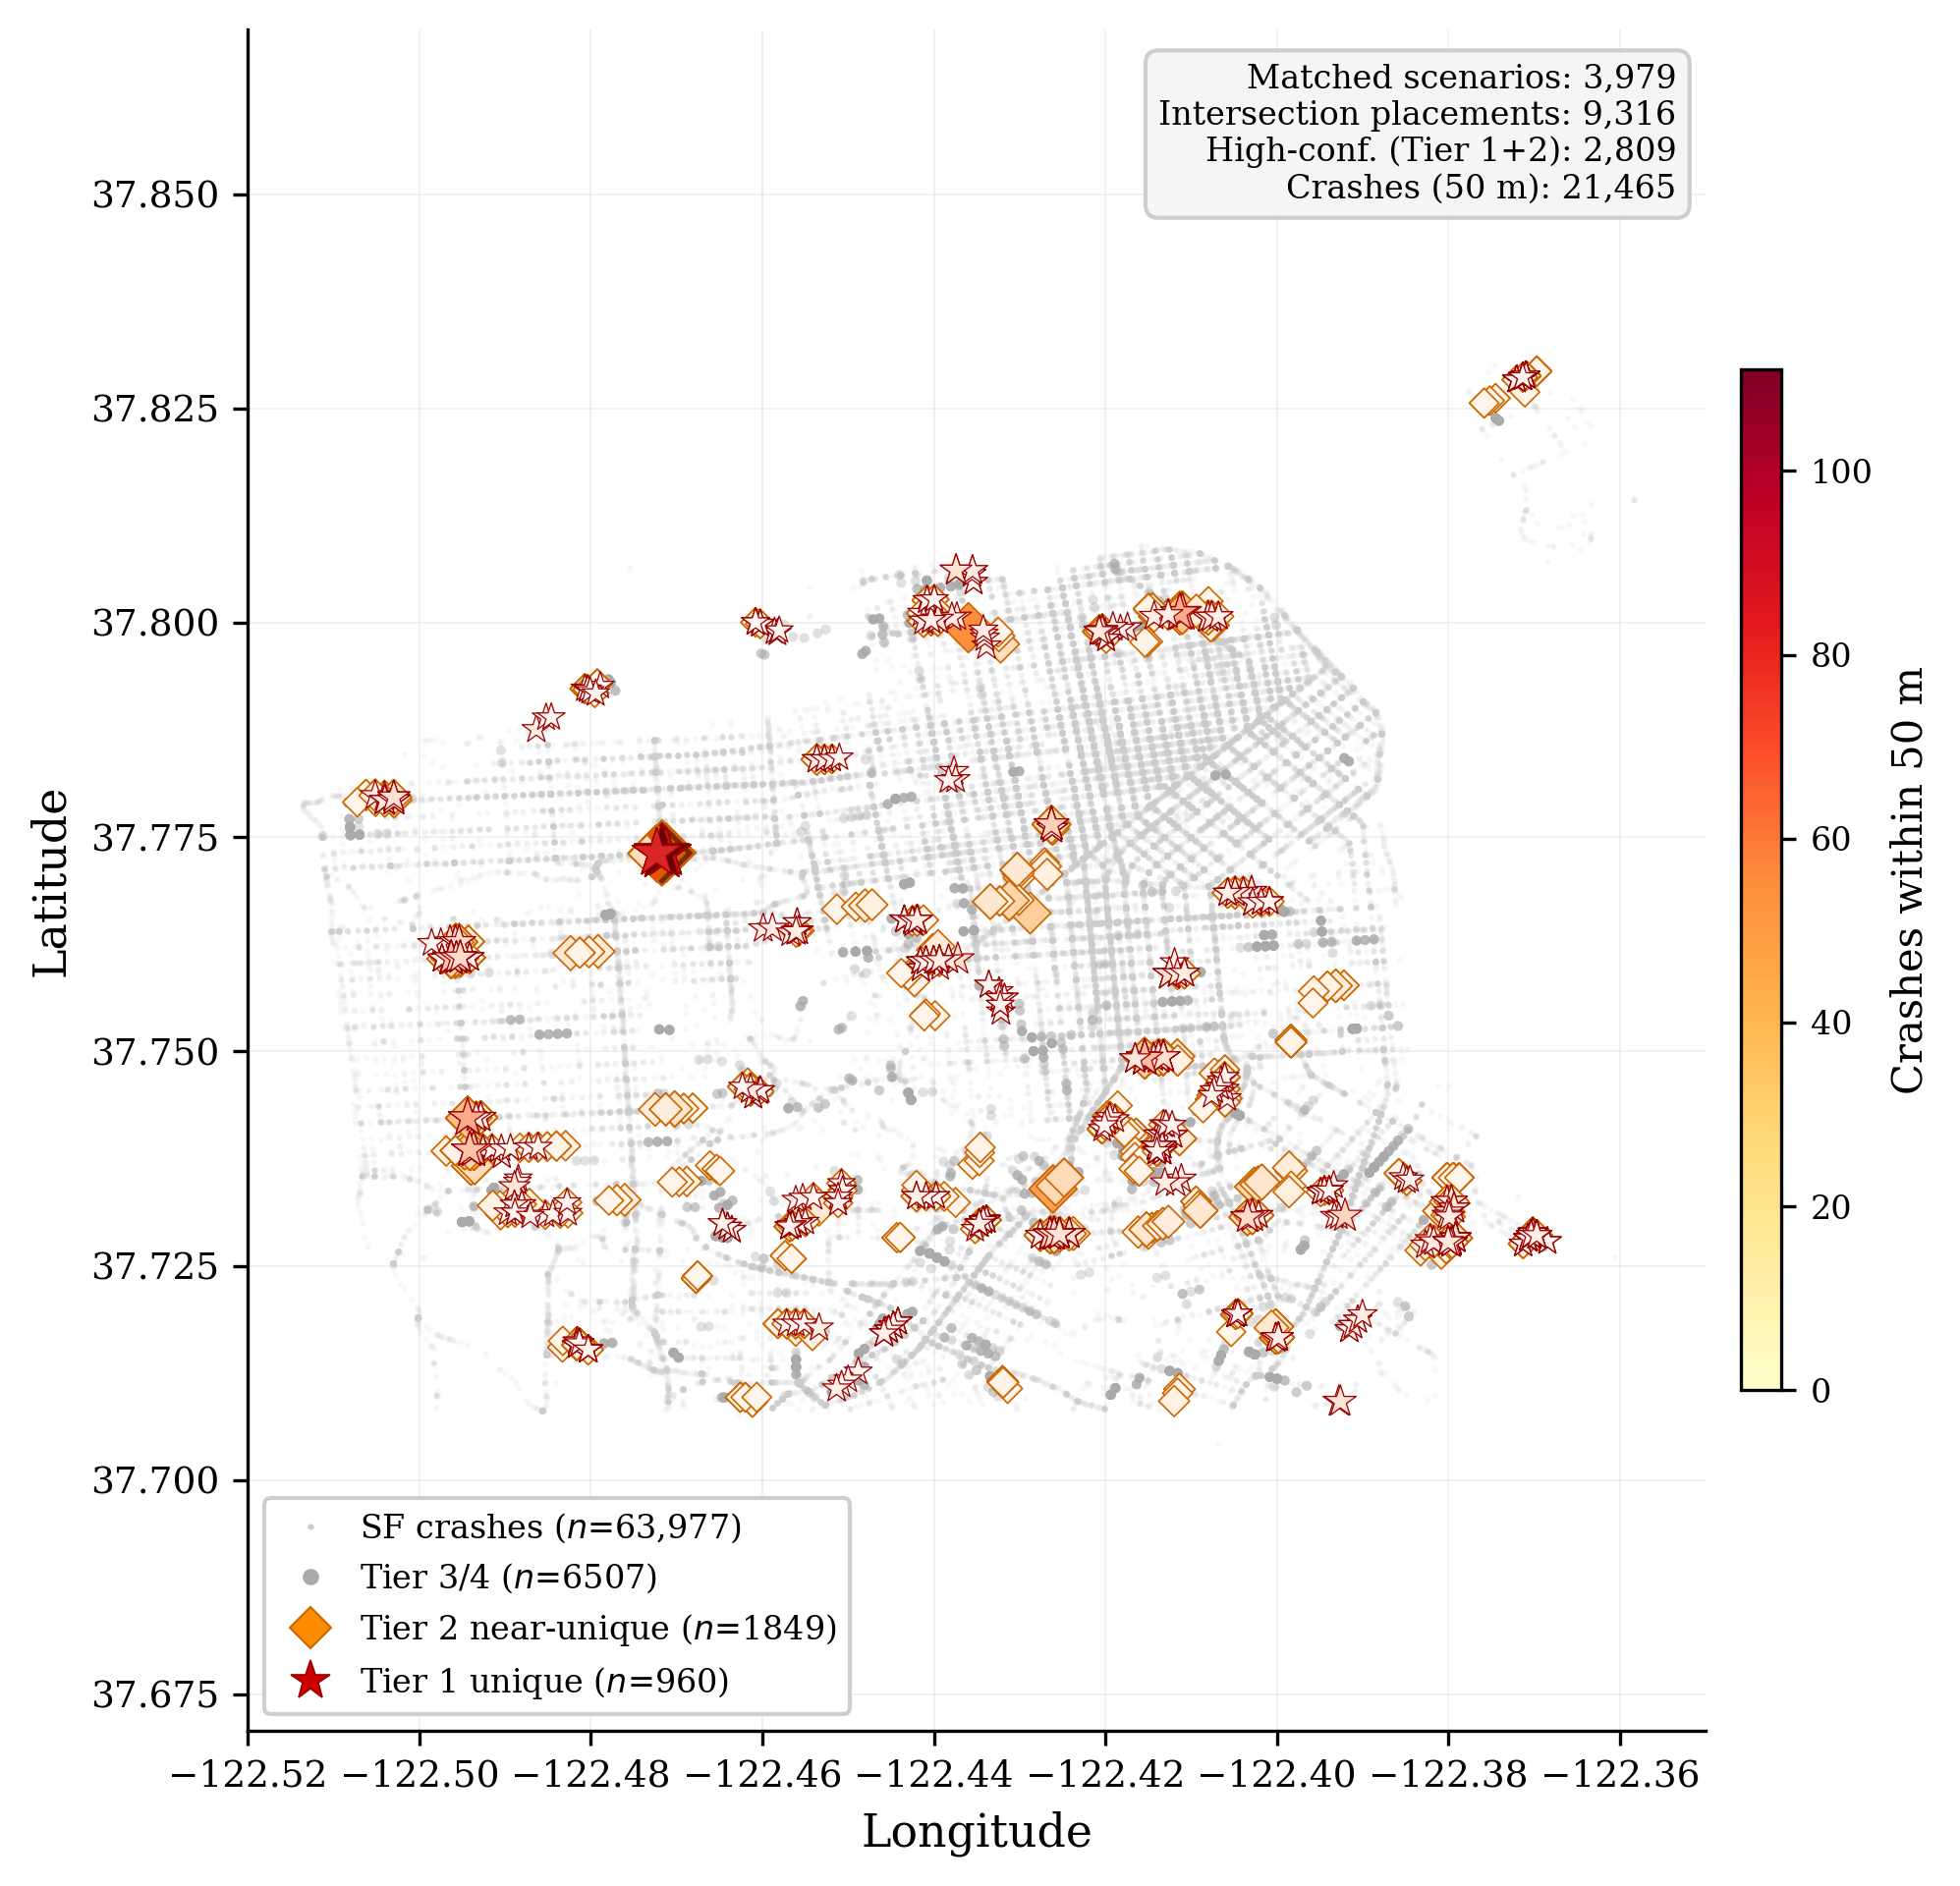
Crash density overlay on matched WOMD intersection locations
WOMD under-samples signalized intersections: 4.3% vs 17.8% city-wide
Sampling bias: WOMD scenarios significantly under-represent signalized intersections (4.3% vs 17.8% city-wide), which may affect the generalizability of models trained exclusively on WOMD data. This finding highlights the importance of understanding dataset composition for autonomous driving research.
Traffic Data Extraction
Once scenarios are localized to real-world intersections, WayGraph extracts detailed traffic
data from the vehicle trajectories within each matched scenario. This bridges the gap between
autonomous driving datasets and traditional traffic engineering, enabling data-driven calibration
of microsimulation models.
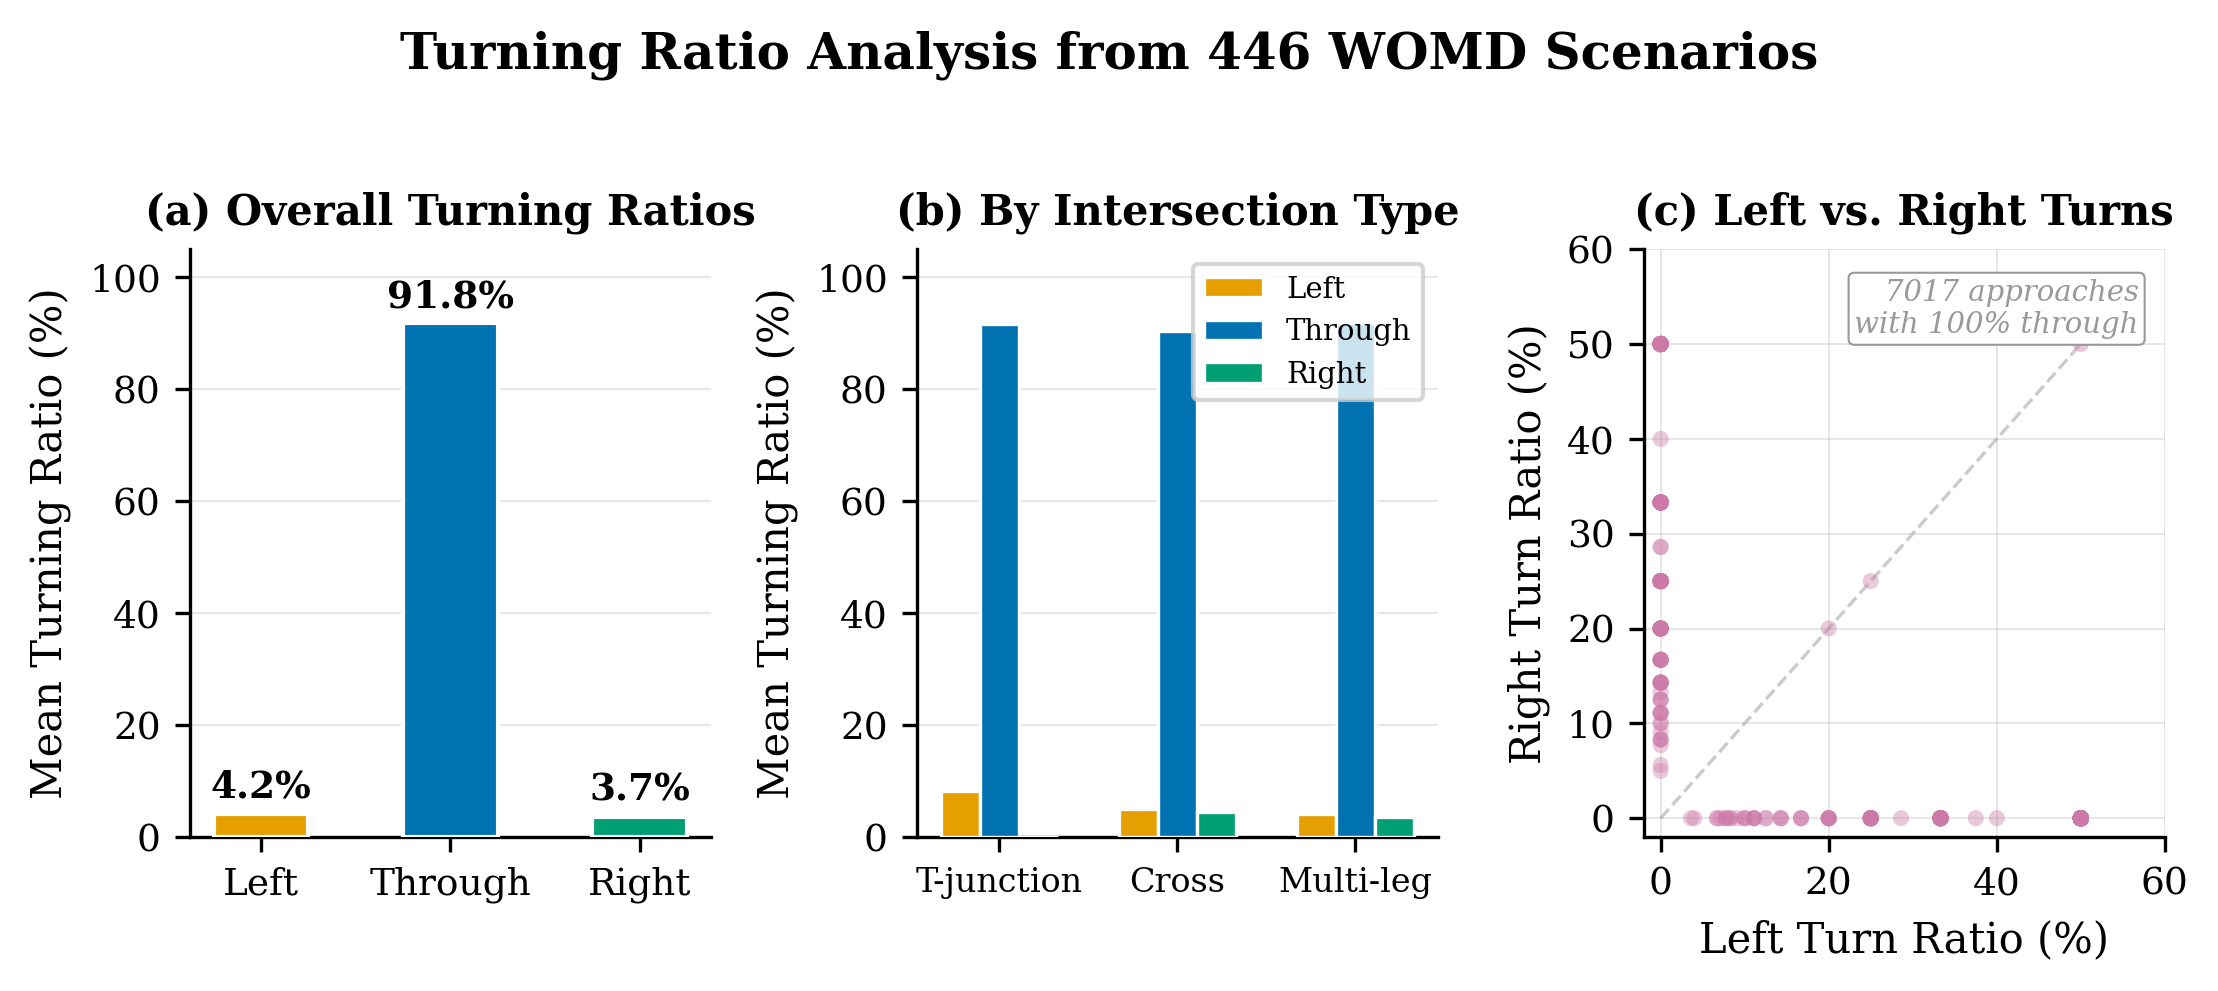
Turning Ratios
Vehicle trajectories within each scenario are classified by movement type (left turn,
through, right turn, U-turn) based on their entry and exit arms. Aggregating across
multiple scenarios at the same intersection yields statistically robust turning ratio estimates.
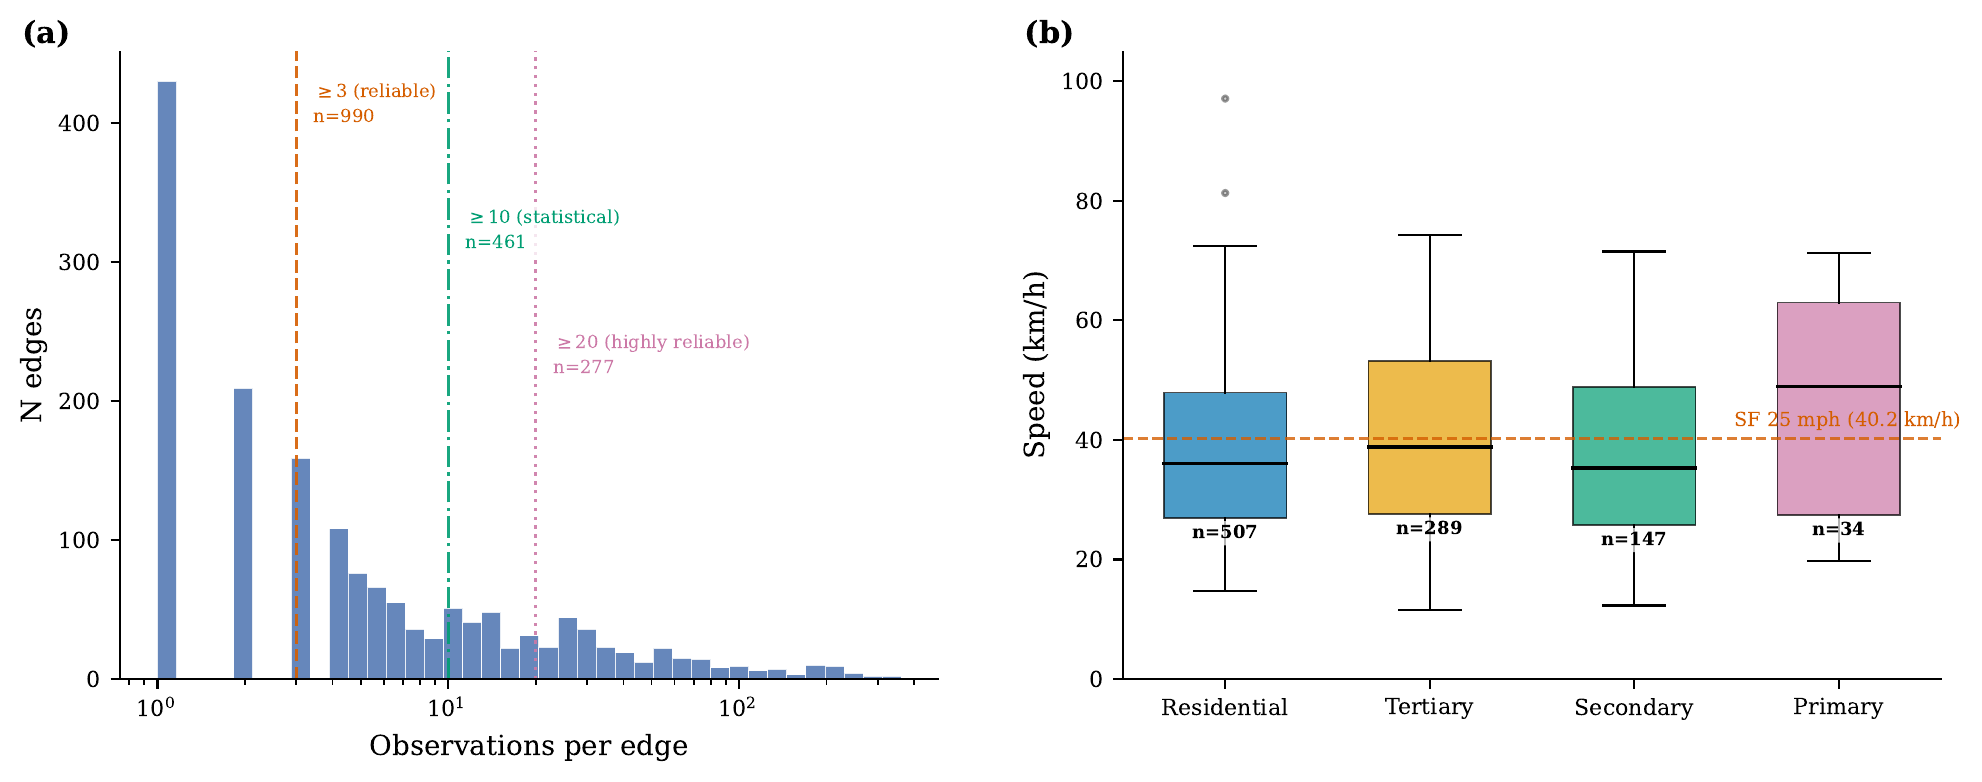
Speed Distributions
Instantaneous and approach speeds are extracted from trajectory data, providing
per-intersection speed profiles segmented by movement type and time of day.
These distributions directly calibrate microsimulation speed parameters.
Gap Acceptance
For unsignalized movements (e.g., left turns at signals during permissive phases),
gap acceptance behavior is extracted by analyzing the time headways between
conflicting vehicles and the decision to proceed or yield.
Impact: Traditional traffic data collection requires expensive field studies
or video surveys. WayGraph enables extraction of this data at scale from existing autonomous
driving datasets — the matched scenarios provide traffic parameters for hundreds of intersections
with no additional data collection cost.
Visual Validation
To verify matching accuracy beyond quantitative metrics, we visually validated 50 randomly selected scenarios against satellite imagery from Google Maps.
100%
Spatial accuracy
50/50 correct locations
56%
Type accuracy
(merge domain gap)
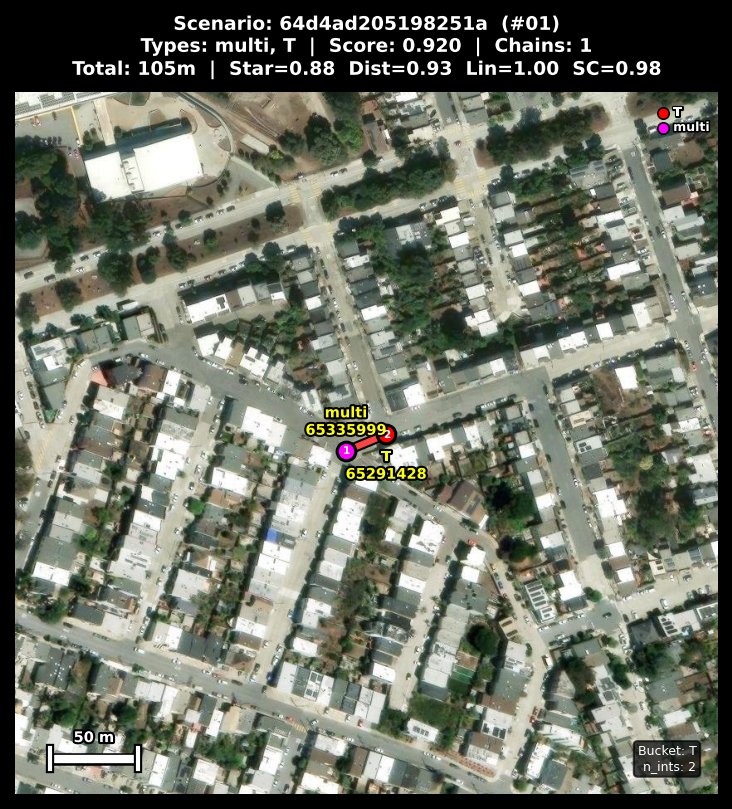
Scenario 1: WOMD lane graph overlaid on satellite imagery — correct match
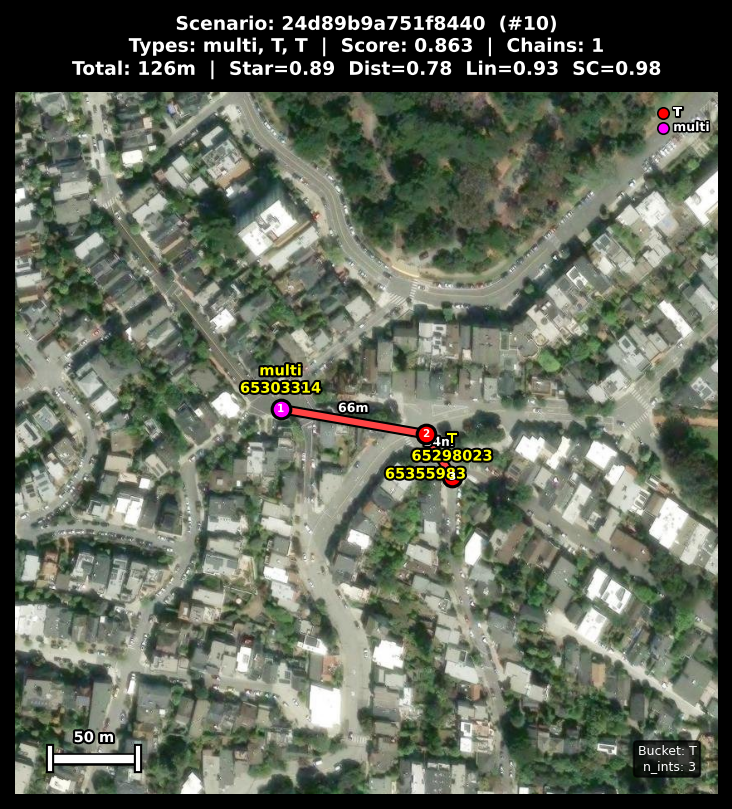
Scenario 10: Complex intersection correctly localized on satellite view
Domain gap: The 56% type accuracy reflects a systematic difference in how WOMD and OSM classify intersection types (particularly merge/diverge zones), not actual localization errors. All 50 validated scenarios were at the correct geographic location.
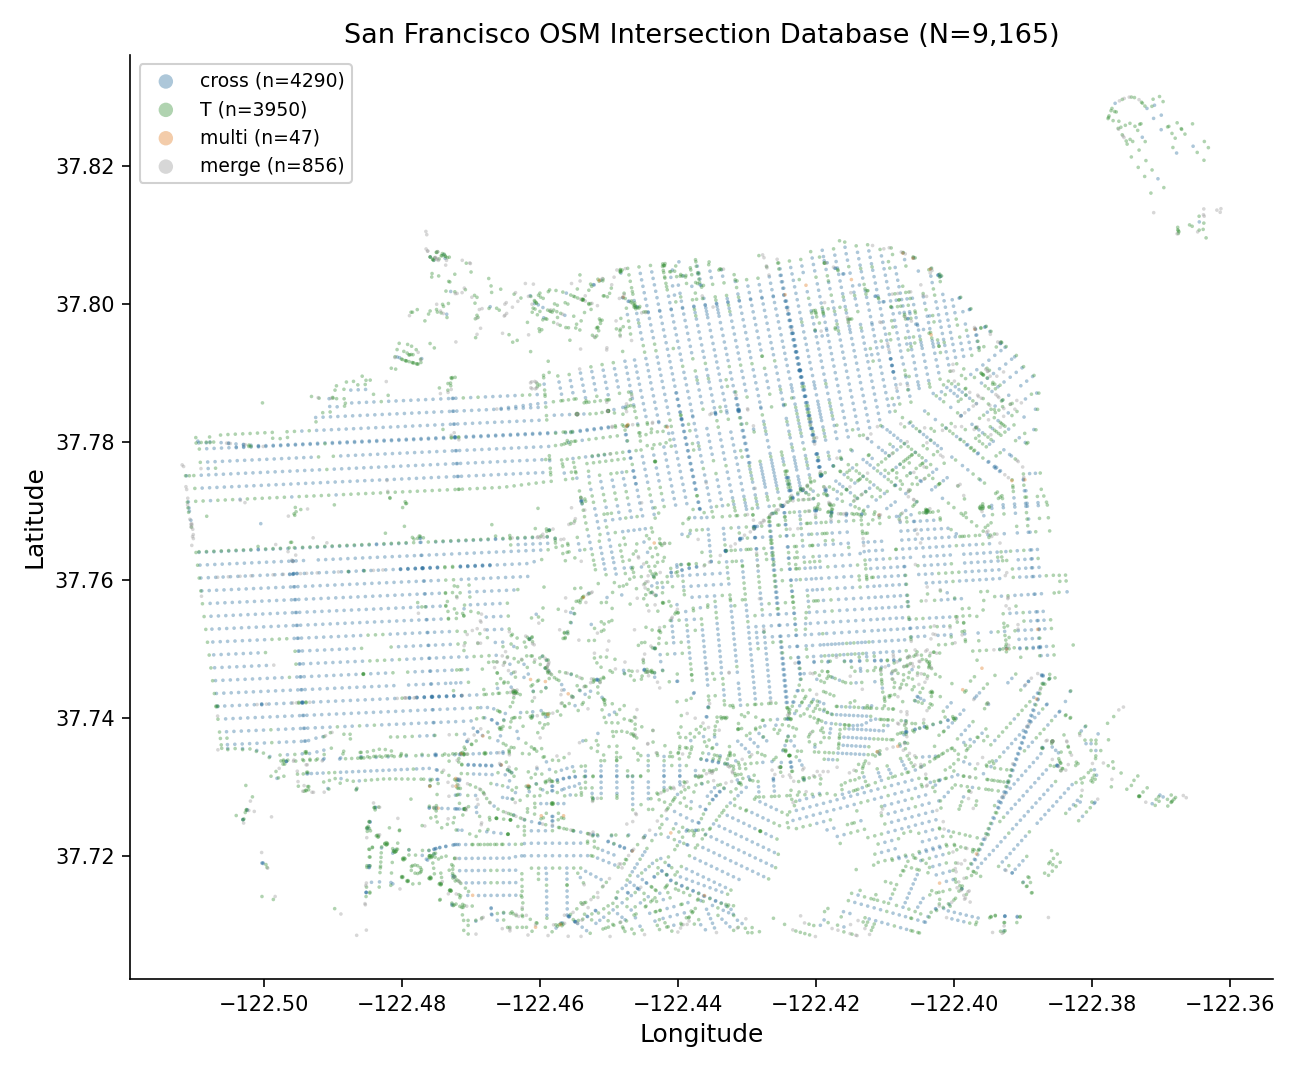
Geographic Coverage
WayGraph has been validated on scenarios from the two major metropolitan areas covered by the
Waymo Open Motion Dataset: San Francisco and Phoenix.
The San Francisco region provides the densest coverage with 5,904 OSM intersections
in the matching database, while Phoenix extends coverage to a different urban morphology
with wider roads and grid-pattern intersections.
Scalability: The WayGraph pipeline is not limited to San Francisco or Phoenix.
Any city covered by OpenStreetMap can serve as a target database — simply download the
OSM data, build the intersection fingerprint database, and run the matching pipeline.
This makes WayGraph applicable to future autonomous driving datasets from any geographic region.