Abstract
(zero training examples)
of 5,760-cell space
in CoT perception
coverage-guided rebalancing
The Sampling Cascade
The sampling cascade formalizes how real-world driving diversity is progressively narrowed across four layers before reaching the model's loss function. Each layer can only reduce or maintain diversity — never increase it. The losses compound multiplicatively.
Crucially, no single layer is "wrong" — the gap emerges from their composition. If each of four layers independently retains 50% of diversity, the cascade retains only 0.54 = 6.25% — and actual retention is far worse because the layers are correlated.
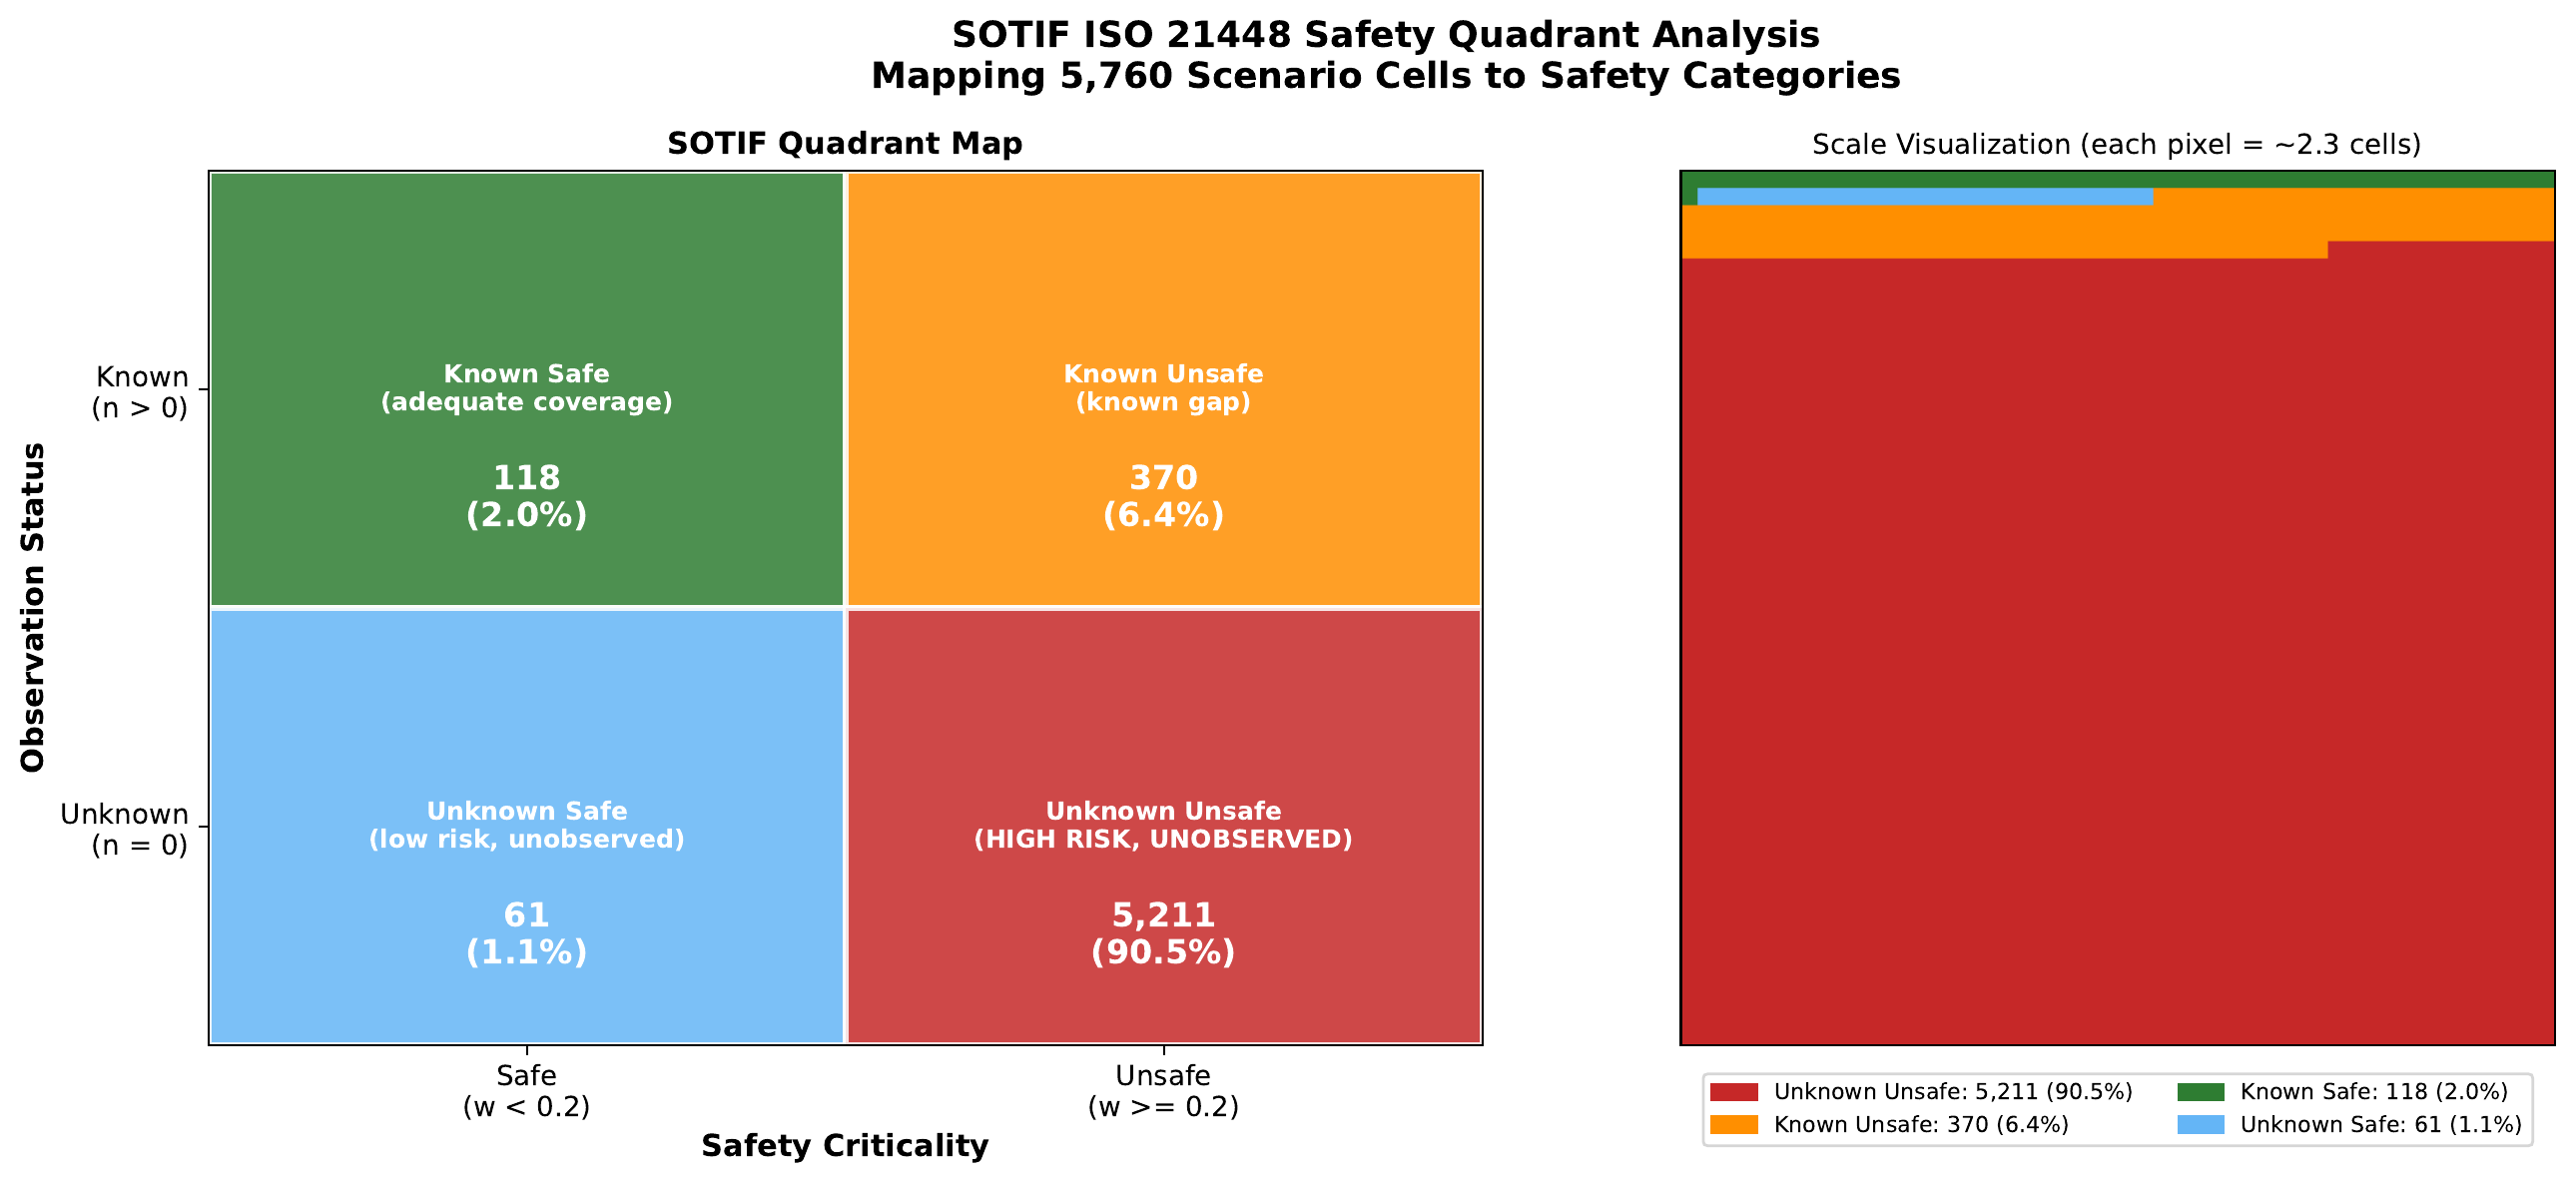
Scenario Space & Safety Coverage
We define the driving scenario space as the Cartesian product of six operationally relevant dimensions, yielding 5,760 cells. Dimensions capture principal factors from NHTSA pre-crash typologies and ISO 21448 (SOTIF) triggering conditions.
| Dimension | Levels | |·| | Safety Rationale |
|---|---|---|---|
| Time | Day, Night, Dusk | 3 | NHTSA: 76% ped. fatalities at night |
| Weather | Clear, Fog, Rain, Snow | 4 | SOTIF triggering condition |
| VRU | None, Ped, Cyclist, Both | 4 | Highest fatality rate |
| Intersection | None, Cross, T, Y, Merge, Roundabout | 6 | NHTSA pre-crash typology |
| Traffic ctrl. | None, Green, Red, Stop, Yield | 5 | Right-of-way complexity |
| Speed | Stopped, Slow, Moderate, Fast | 4 | Kinetic energy / stopping distance |
| Total cells | 5,760 (3 × 4 × 4 × 6 × 5 × 4) | ||
Safety-Critical Findings
We conducted 15 pre-specified statistical tests with Bonferroni correction (α = 0.05/15 = 0.0033). Fourteen of 15 tests achieve significance. Four findings constitute novel safety-critical paradoxes:
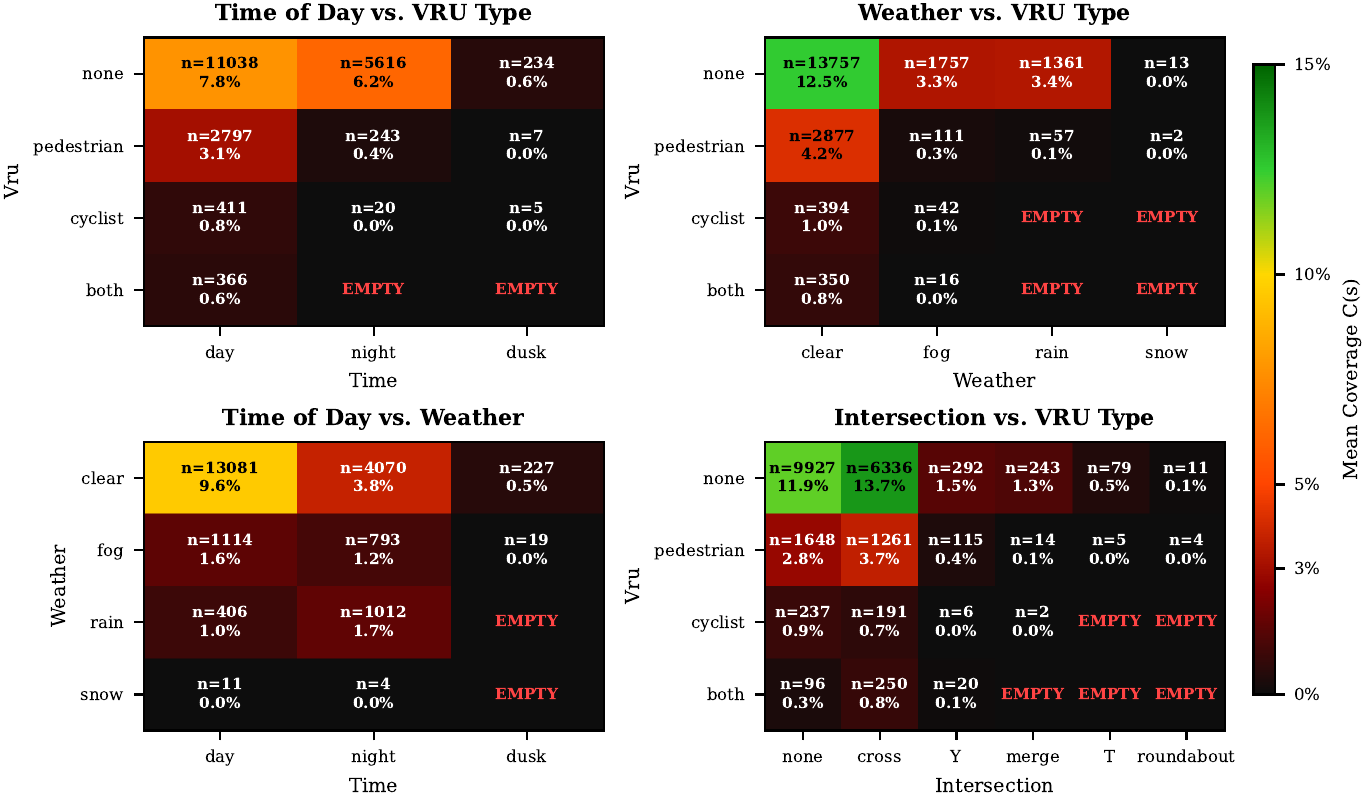
1. The VRU Visibility Cliff
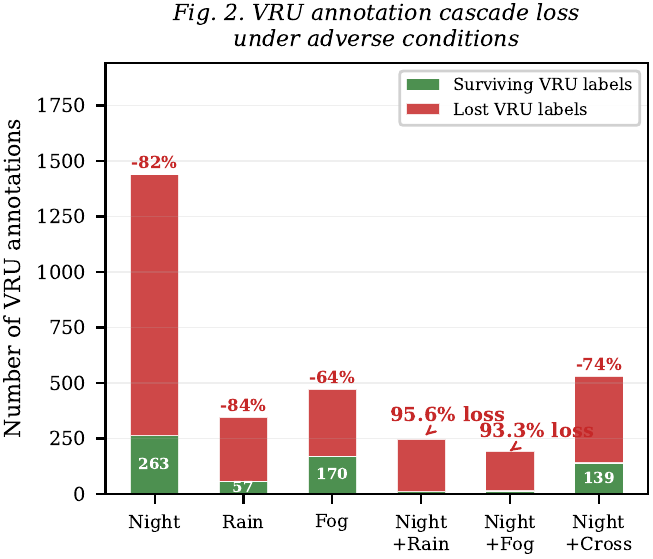
VRU annotations collapse catastrophically under adverse conditions. Daytime: 24.5% of frames contain a VRU. At night: 4.5% — a 5.5-fold reduction. Pedestrians: 21.7% (day) → 4.1% (night), OR = 6.41, p < 10-250. Cyclists: 5.3% → 0.34% (night), OR = 16.43. Rain contains zero cyclist annotations — a complete absence. Under compound conditions (night + rain), 95.6% of expected VRU observations are eliminated.
2. The Yield Sign Paradox
Yield sign scenarios constitute only 3.5% of the dataset but exhibit the highest VRU rate (46.0%) and conflict rate (41.0%) of any traffic control category — a 2.6× and 4.5× multiplier over the dataset average. A model trained with uniform loss weighting encounters yield sign scenarios in only 1 out of every 28 gradient updates.
3. The Green Light Paradox
Green traffic signals contain a higher VRU rate (20.7%) than red light scenes (16.4%), yet the teacher model's annotated deceleration rate at green lights is only 6.8% compared to 38.2% at red lights — a 5.6× differential. The model learns that green licenses acceleration, but the actual safety-critical variable is VRU presence, not signal state.
4. Survivorship Bias in Nighttime VRU Response
Among the 263 frames where VRUs are detected at night, the deceleration rate is 31.2% — significantly higher than the daytime rate of 20.6% (OR = 0.57, p = 0.002). This counter-intuitive result reflects survivorship bias: VRUs that cross the nighttime detection threshold are disproportionately close, salient, and collision-imminent.
CoT Perception & Trajectory Analysis
We evaluated CTL-Drive's Chain-of-Thought predictions on 472 frames against Gemini Flash 3 teacher annotations. The model accurately detects common objects (nearby vehicles F1 = 0.97, traffic elements F1 = 0.93) but struggles with safety-critical categories:
(53/152 ground-truth)
miss rate
for speed-behavior mismatches
(F1 = 0.93)
Speed-behavior analysis reveals that 12.5% of frames are "dangerous misses" — the model recommends maintain/accelerate when the teacher says decelerate. These frames have ADE = 1.72m vs 1.23m for speed matches (p < 0.001). The dangerous miss rate is highest for yield signs (40.0%) and merge intersections (27.3%).
Case Study: 42-Rank Improvement
We illustrate how the sampling cascade framework guided concrete model improvements by documenting the development of CTL-Drive from V4 (RFS 6.538, rank 57/67) to V8 (RFS 7.705, rank 15/67) — a 42-rank improvement on the WOD-E2E leaderboard.
Diagnosis via Coverage Analysis
Applying the cascade framework revealed two actionable distributional imbalances:
Treatment & Results
Left turns oversampled 5×, right turns 4×, expanding effective training from 20,782 to 90,079 samples. The RFS improvement of 1.167 points was not uniform: turn-heavy clusters showed the largest gains. CTL-Drive V8 achieves RFS 8.027 on Special Vehicles — exceeding the #1 ranked model NTR (7.751) on this cluster.
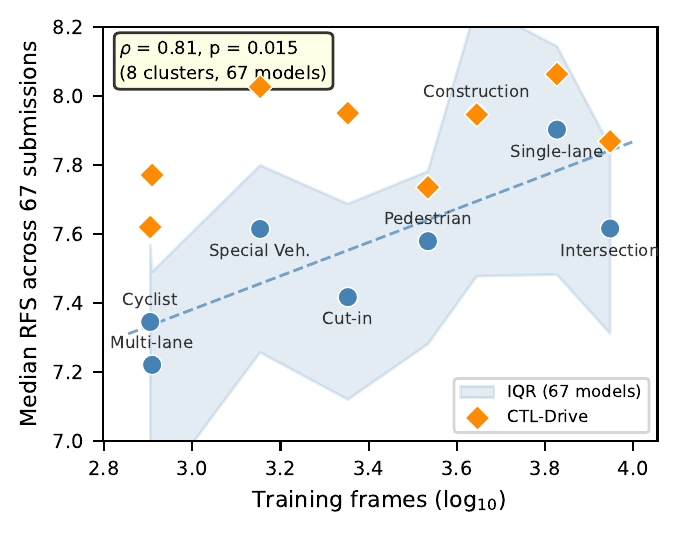
Coverage-Performance Link Across 67 Models
To test whether the coverage-performance relationship generalizes, we analyzed all 67 WOD-E2E leaderboard submissions. Mapping 8 of the 11 evaluation clusters to training-data proxies, the median per-cluster RFS correlates with training data volume (Spearman ρ = 0.71, p = 0.047). This pattern holds for 92.5% of individual submissions, confirming that the coverage-performance link is architecture-independent.
RFS and ADE@5s are strongly correlated across 67 submissions (ρ = −0.78, p < 10-4), validating ADE as a reasonable proxy for human preference evaluation.
Citation
@article{zhou2026sampling,
  title={The Sampling Cascade: How Data Collection Bias Creates
         Systematic Safety Blind Spots in VLM-Based Autonomous Driving},
  author={Zhou, Xingnan and Alecsandru, Ciprian},
  journal={IEEE Transactions on Intelligent Vehicles},
  year={2026},
  note={Under review}
}