Abstract
Method
Framework Overview
Our visualization framework consists of three components built on top of an MTR-Lite Transformer trained on the Waymo Open Motion Dataset (20% subset, ~17,800 scenes):
- Attention-Capture Layers — Custom Transformer layers that extract per-head attention weight matrices from every encoder and decoder layer without altering predictions
- Spatial Token Bookkeeping — A bidirectional mapping between abstract token indices and physical BEV coordinates, enabling projection of attention weights onto the traffic scene
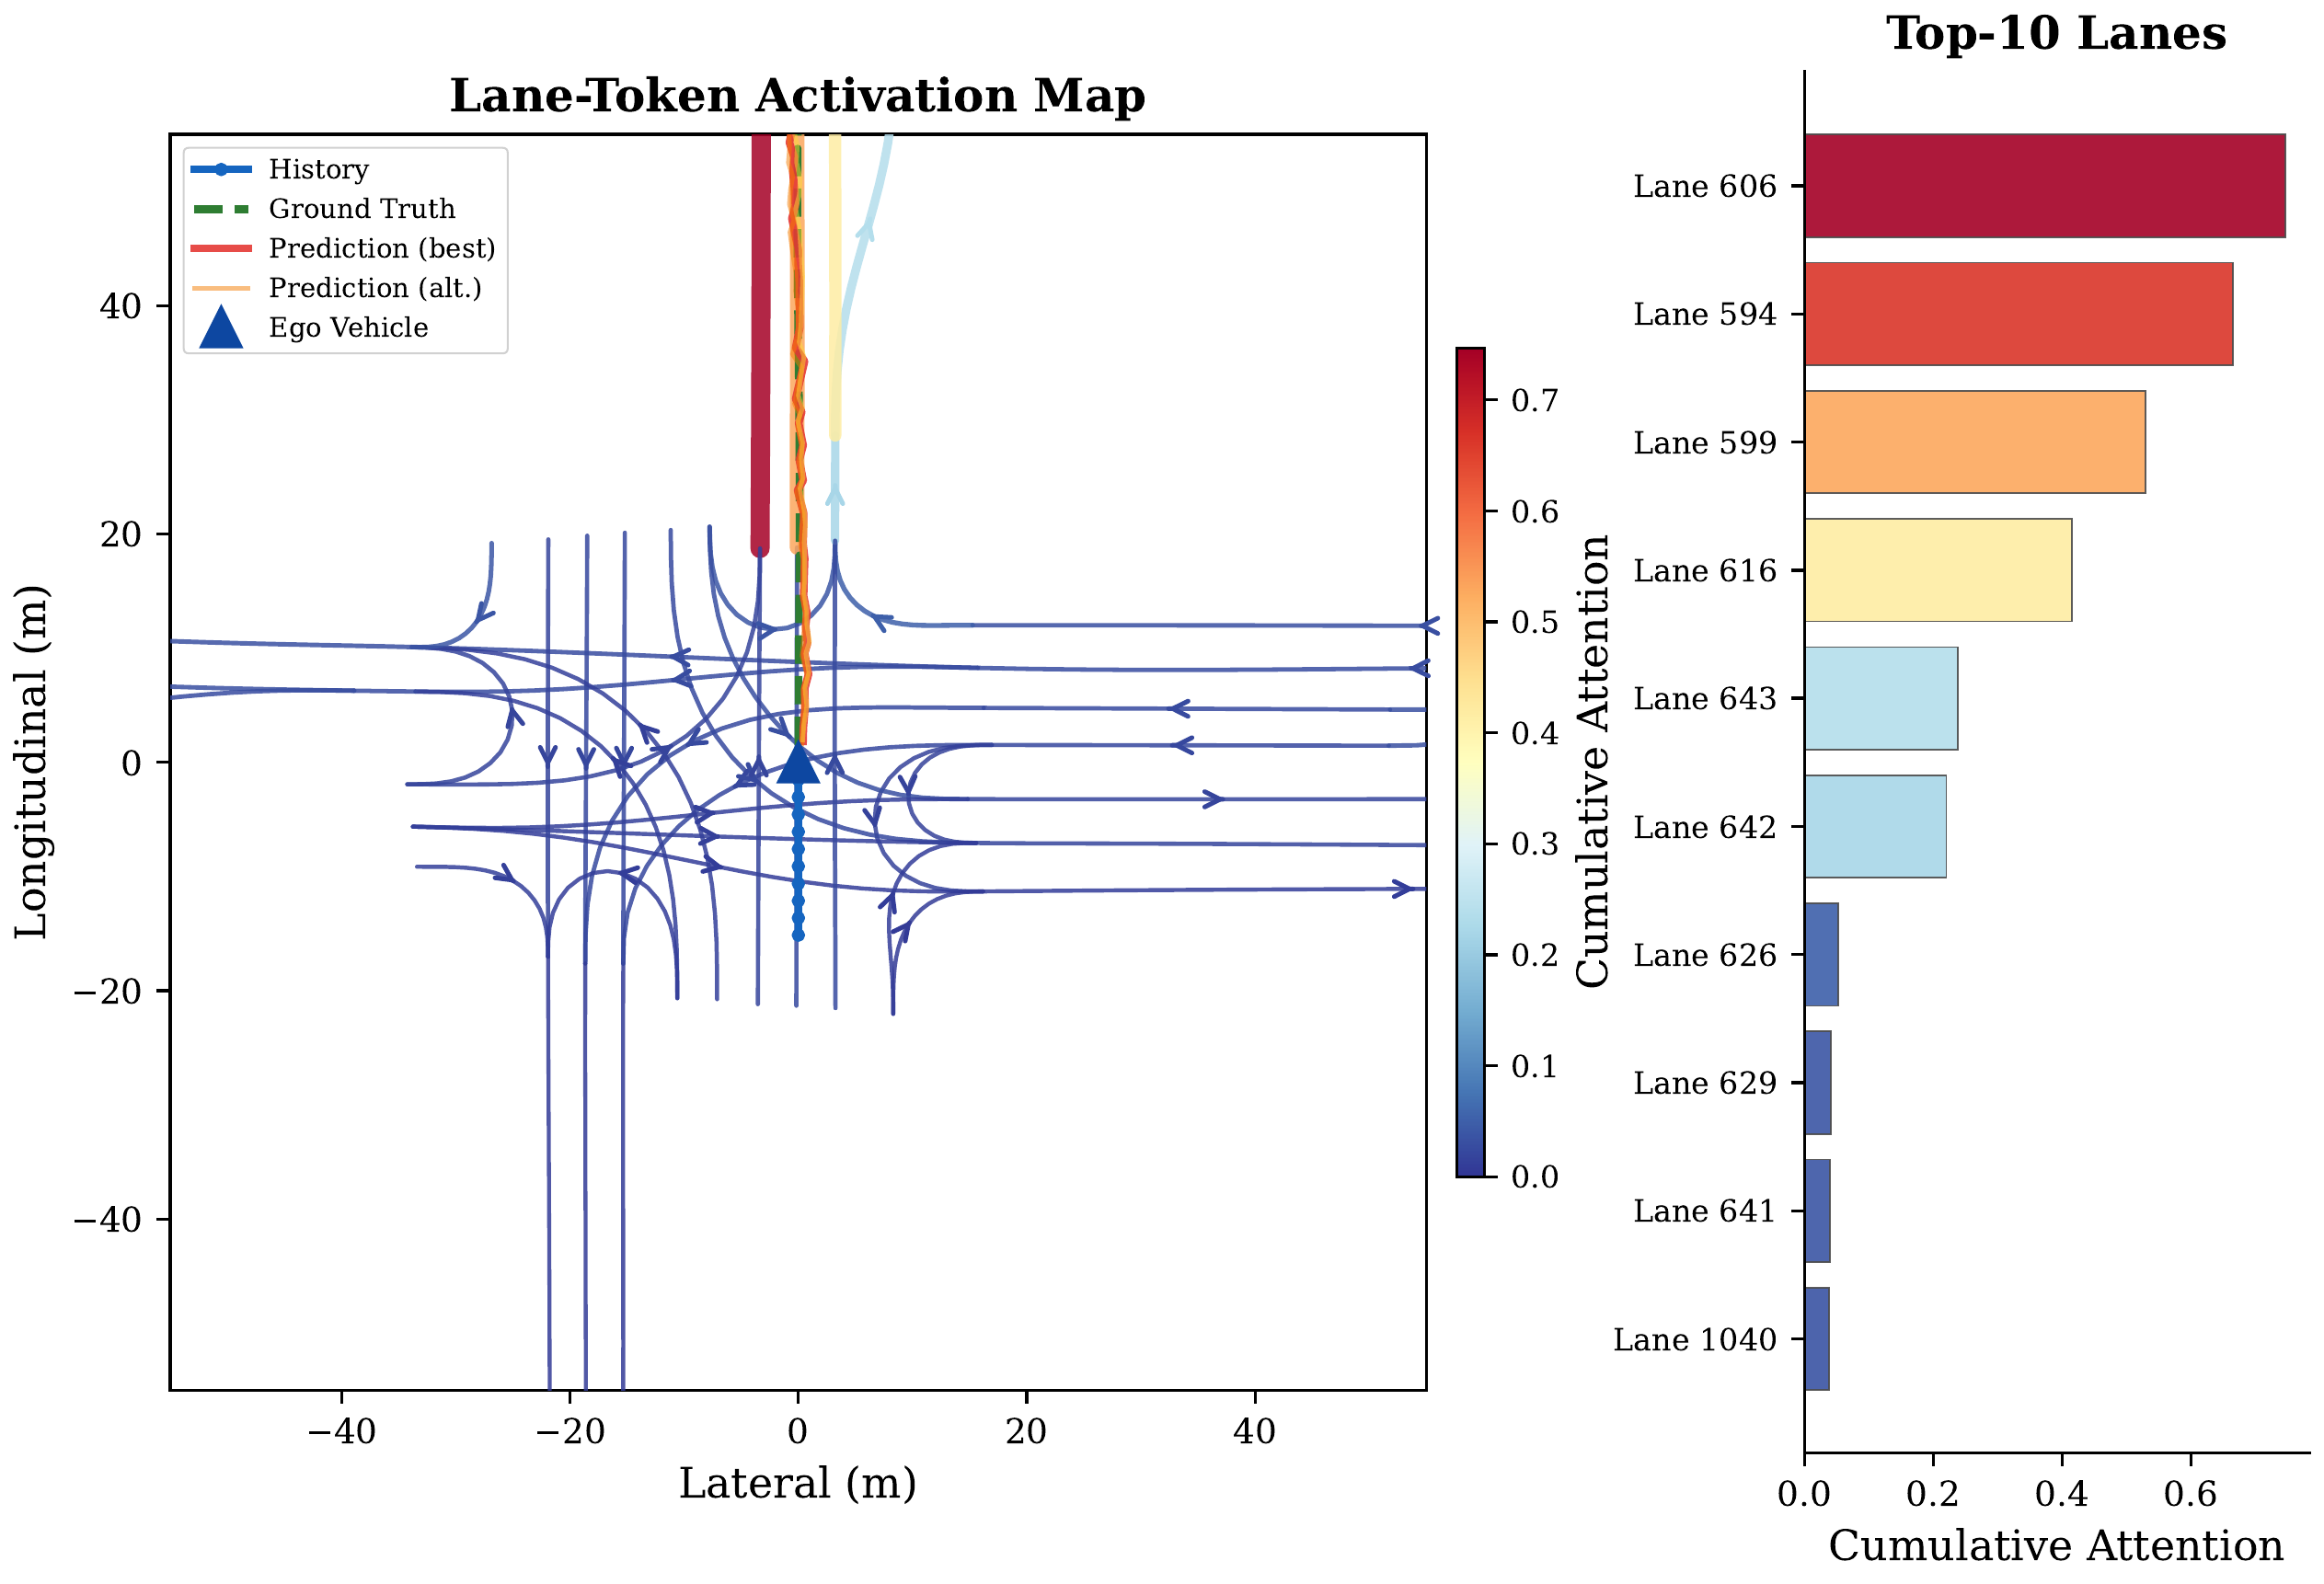
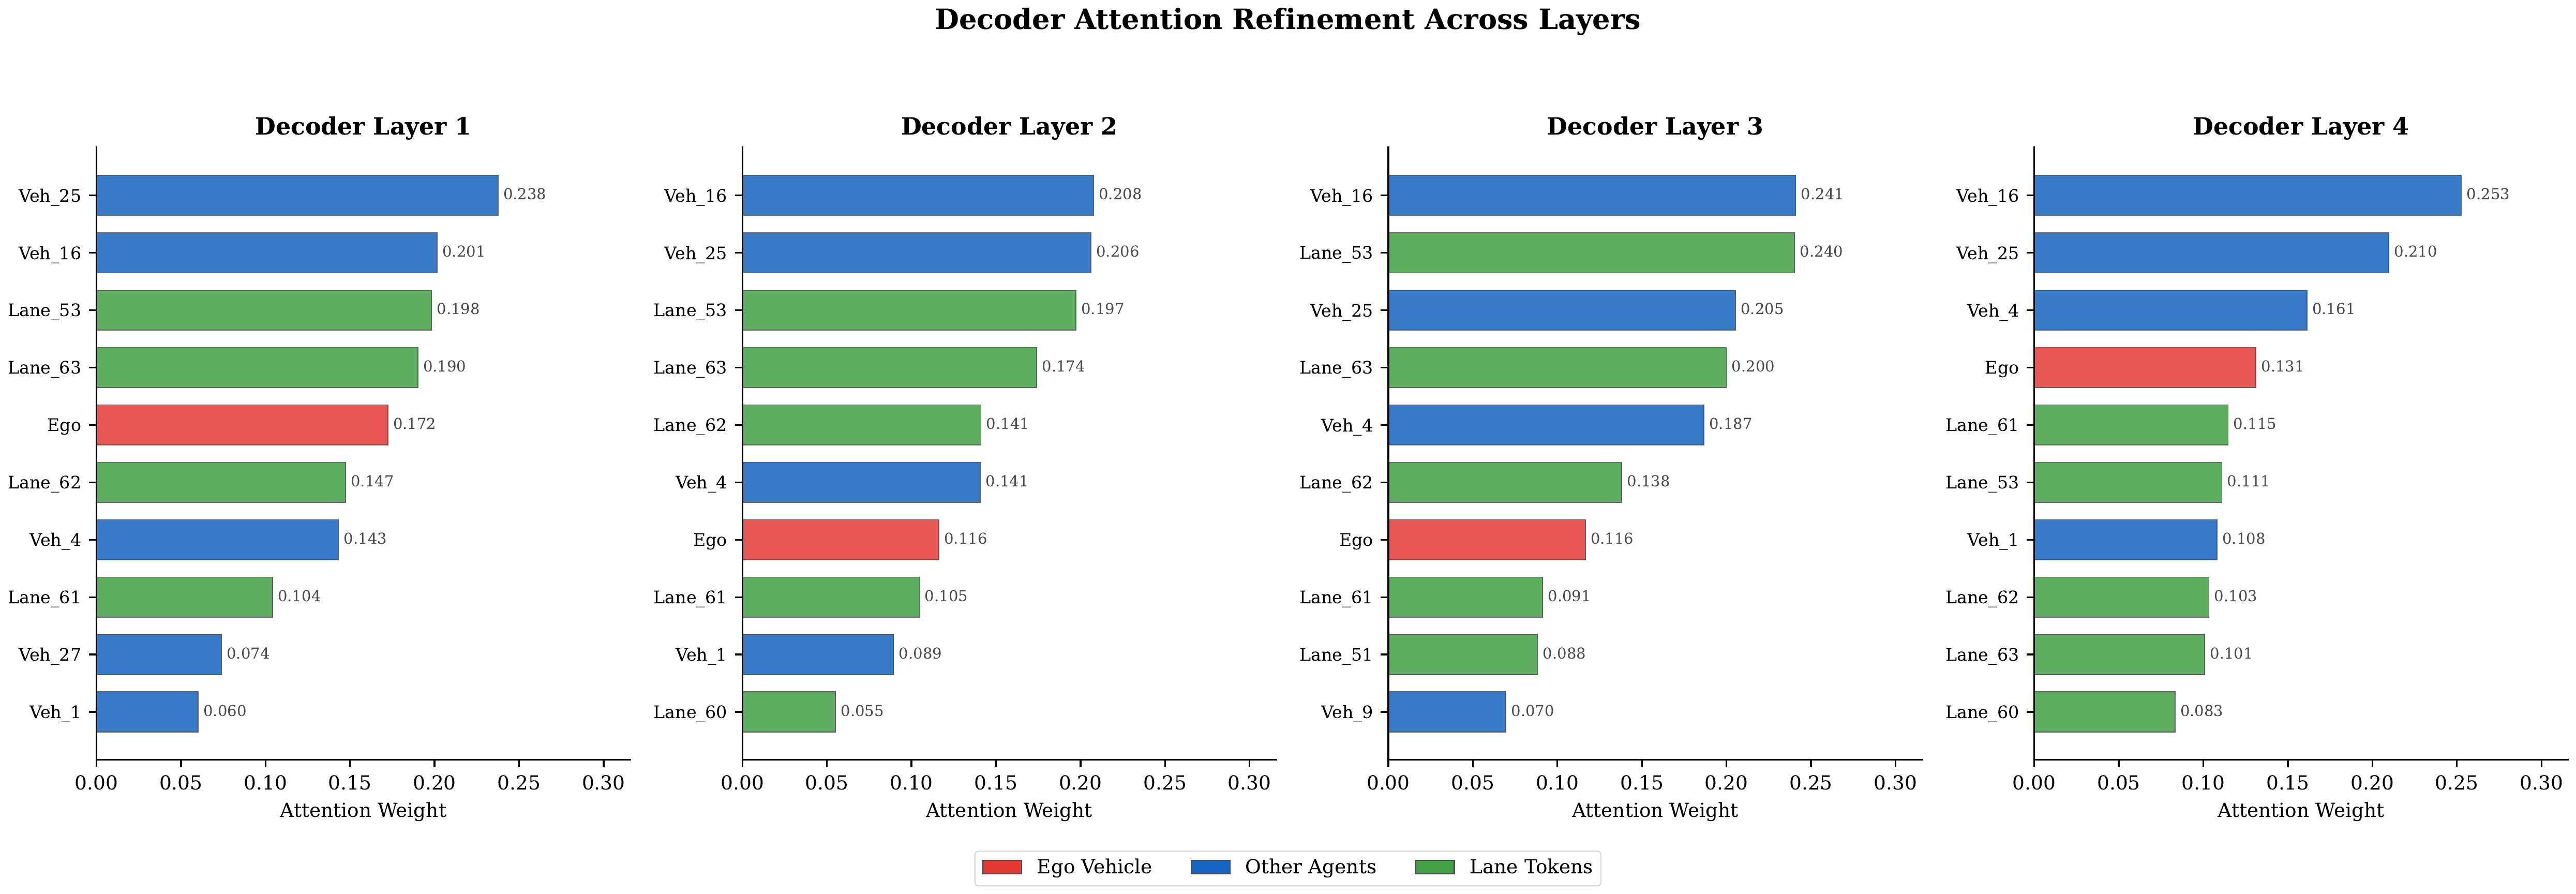
- Three Visualization Types — Space-attention BEV heatmaps (where), time-attention refinement diagrams (how attention evolves across layers), and lane-token activation maps (which road structures guide prediction)
MTR-Lite Architecture
A lightweight Motion Transformer variant with 4 encoder layers (global self-attention over 32 agent + 64 map tokens), 4 decoder layers (agent cross-attention + map cross-attention), and 64 intention queries refined into K=6 output modes via NMS. Trained for 60 epochs on Waymo with AdamW, cosine annealing, and mixed-precision training.
Counterfactual Experiments
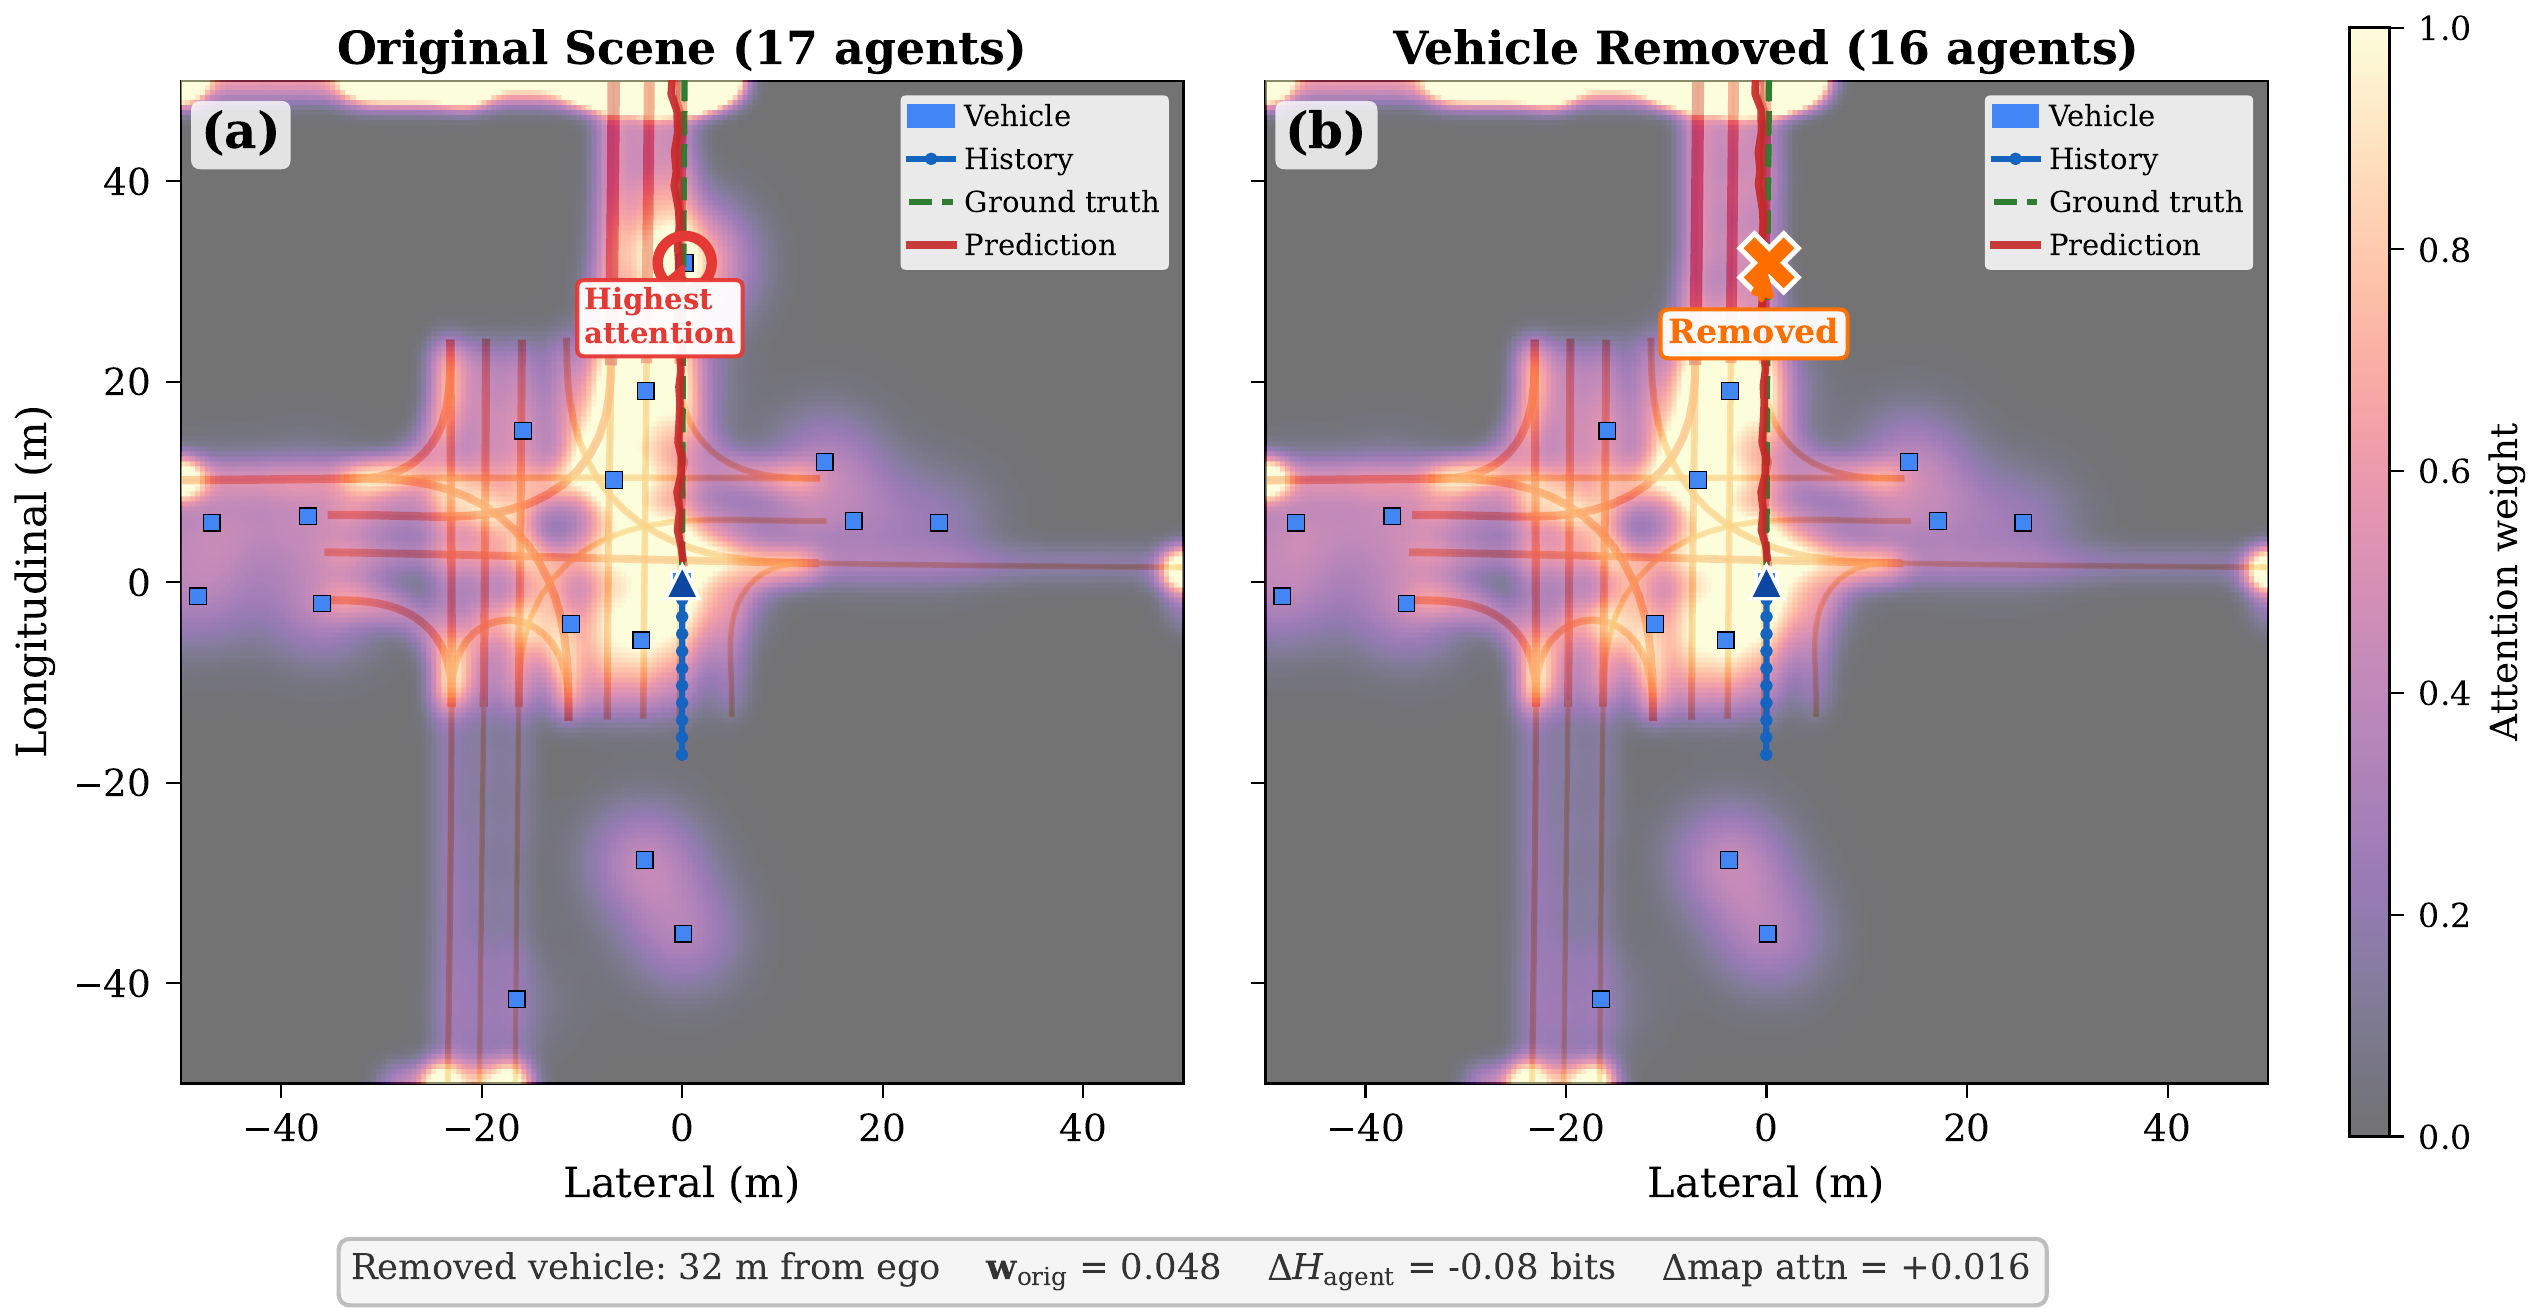
By directly editing scene dictionaries (removing agents, flipping traffic signals, injecting pedestrians at varying distances), we perform the first counterfactual attention analysis for trajectory prediction — enabling causal (not just correlational) claims about how scene elements influence model reasoning.
Animated Attention Demonstrations
These animations show how attention evolves across encoder layers and over time for different driving scenarios.
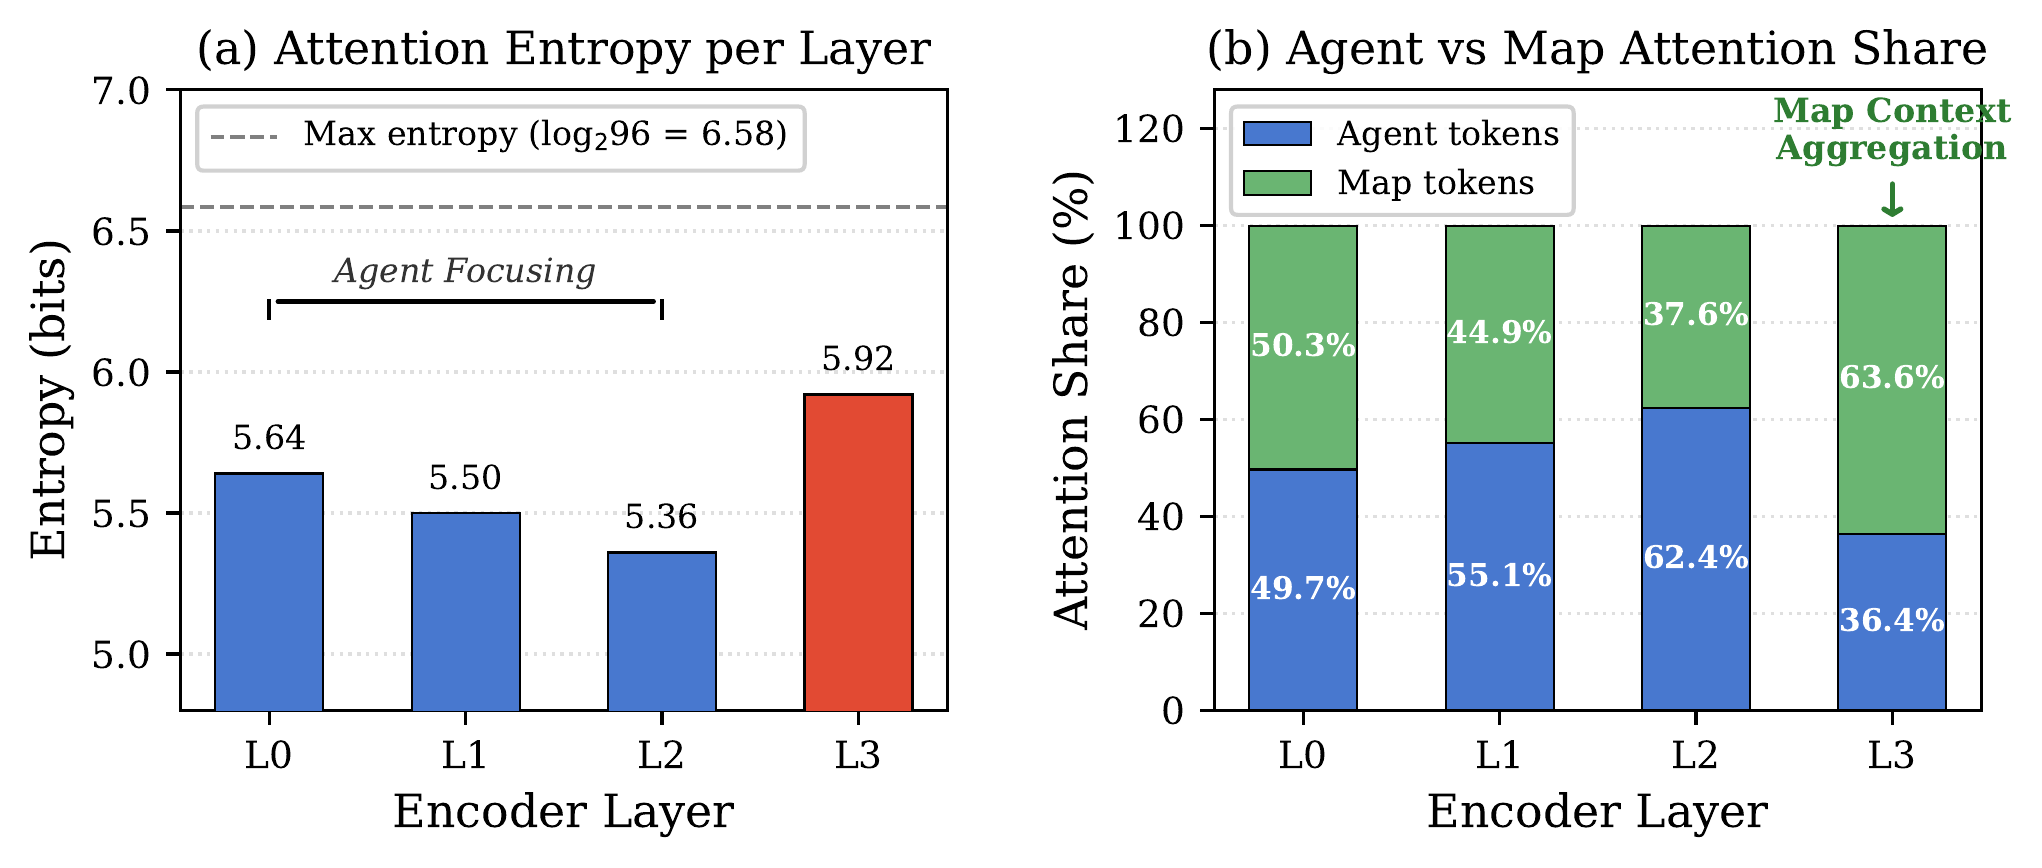
Attention Evolution Across Encoder Layers
Temporal Attention Dynamics
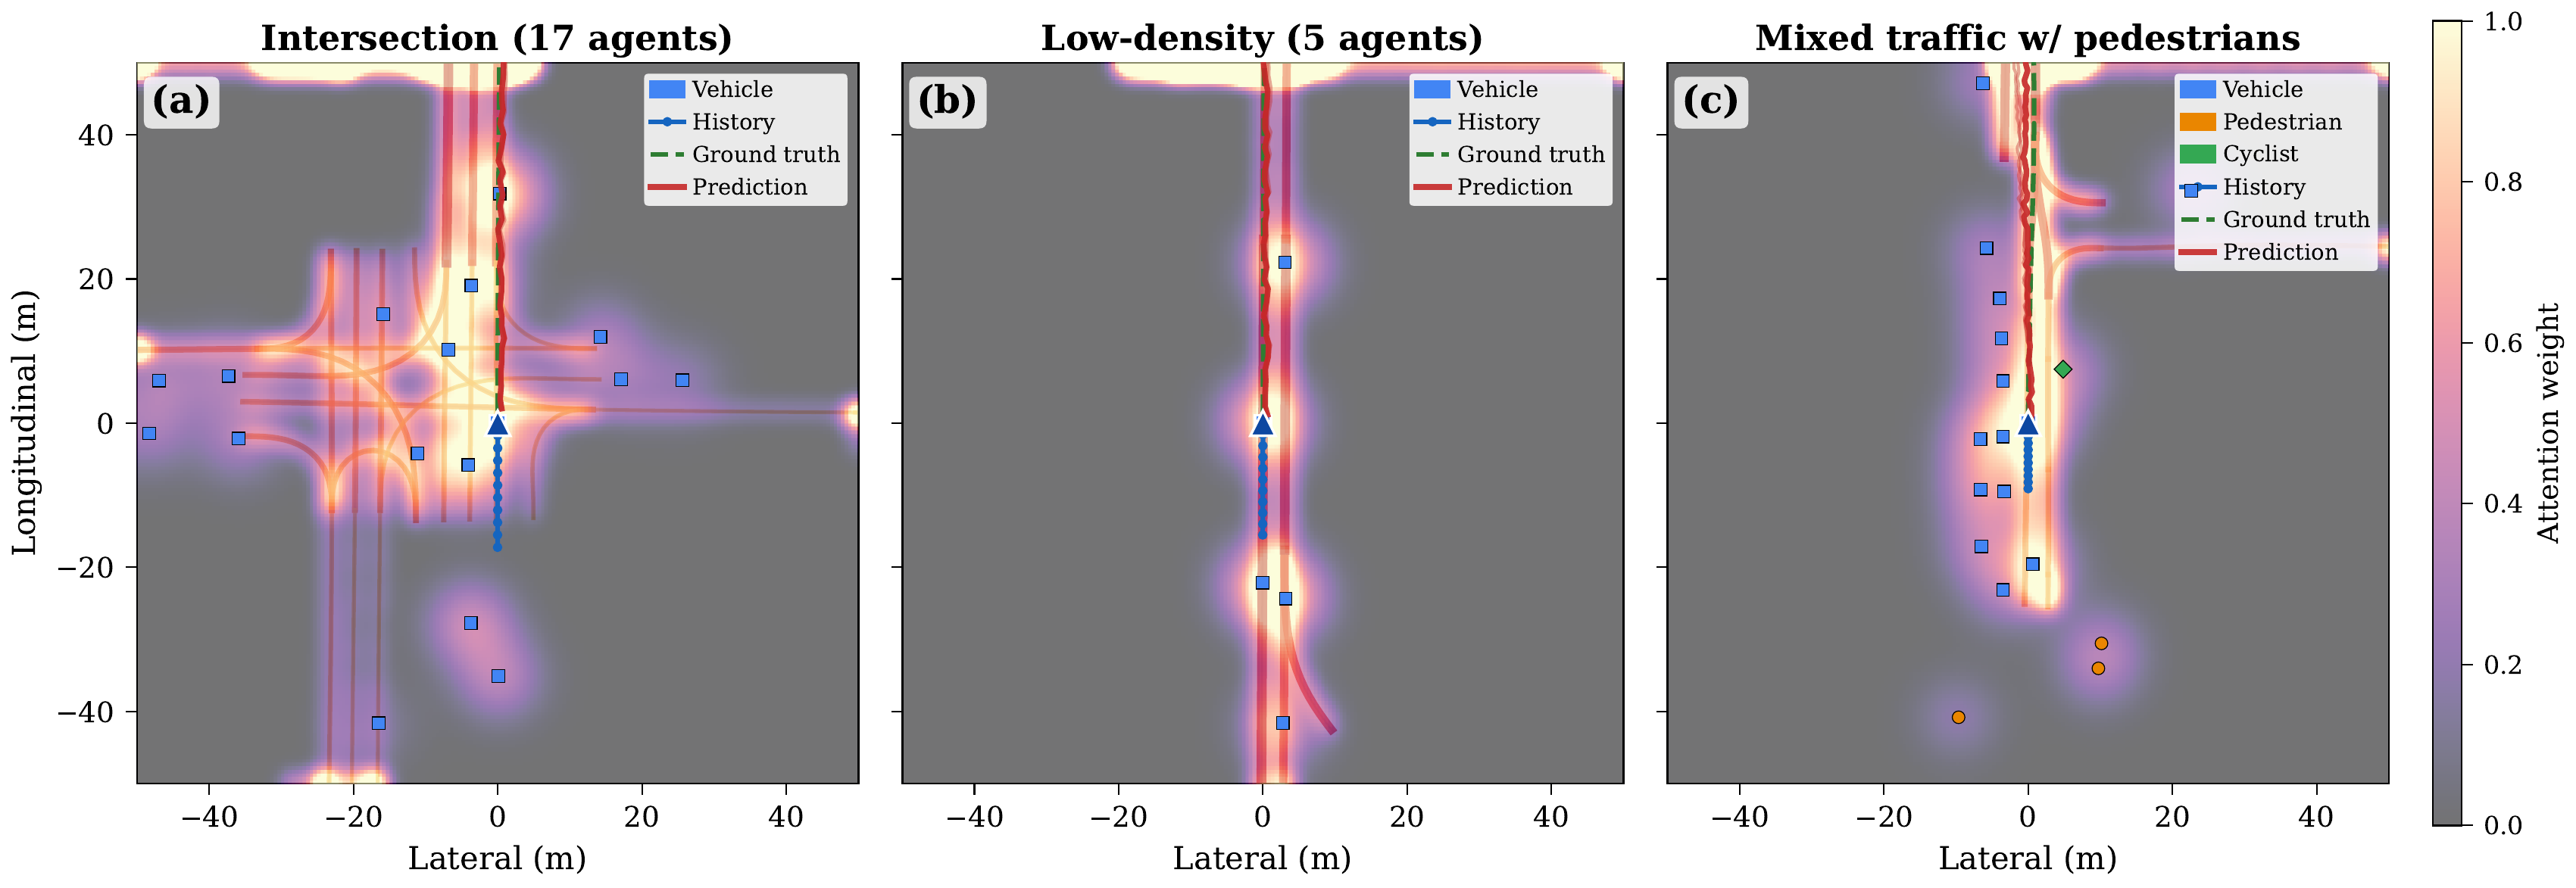
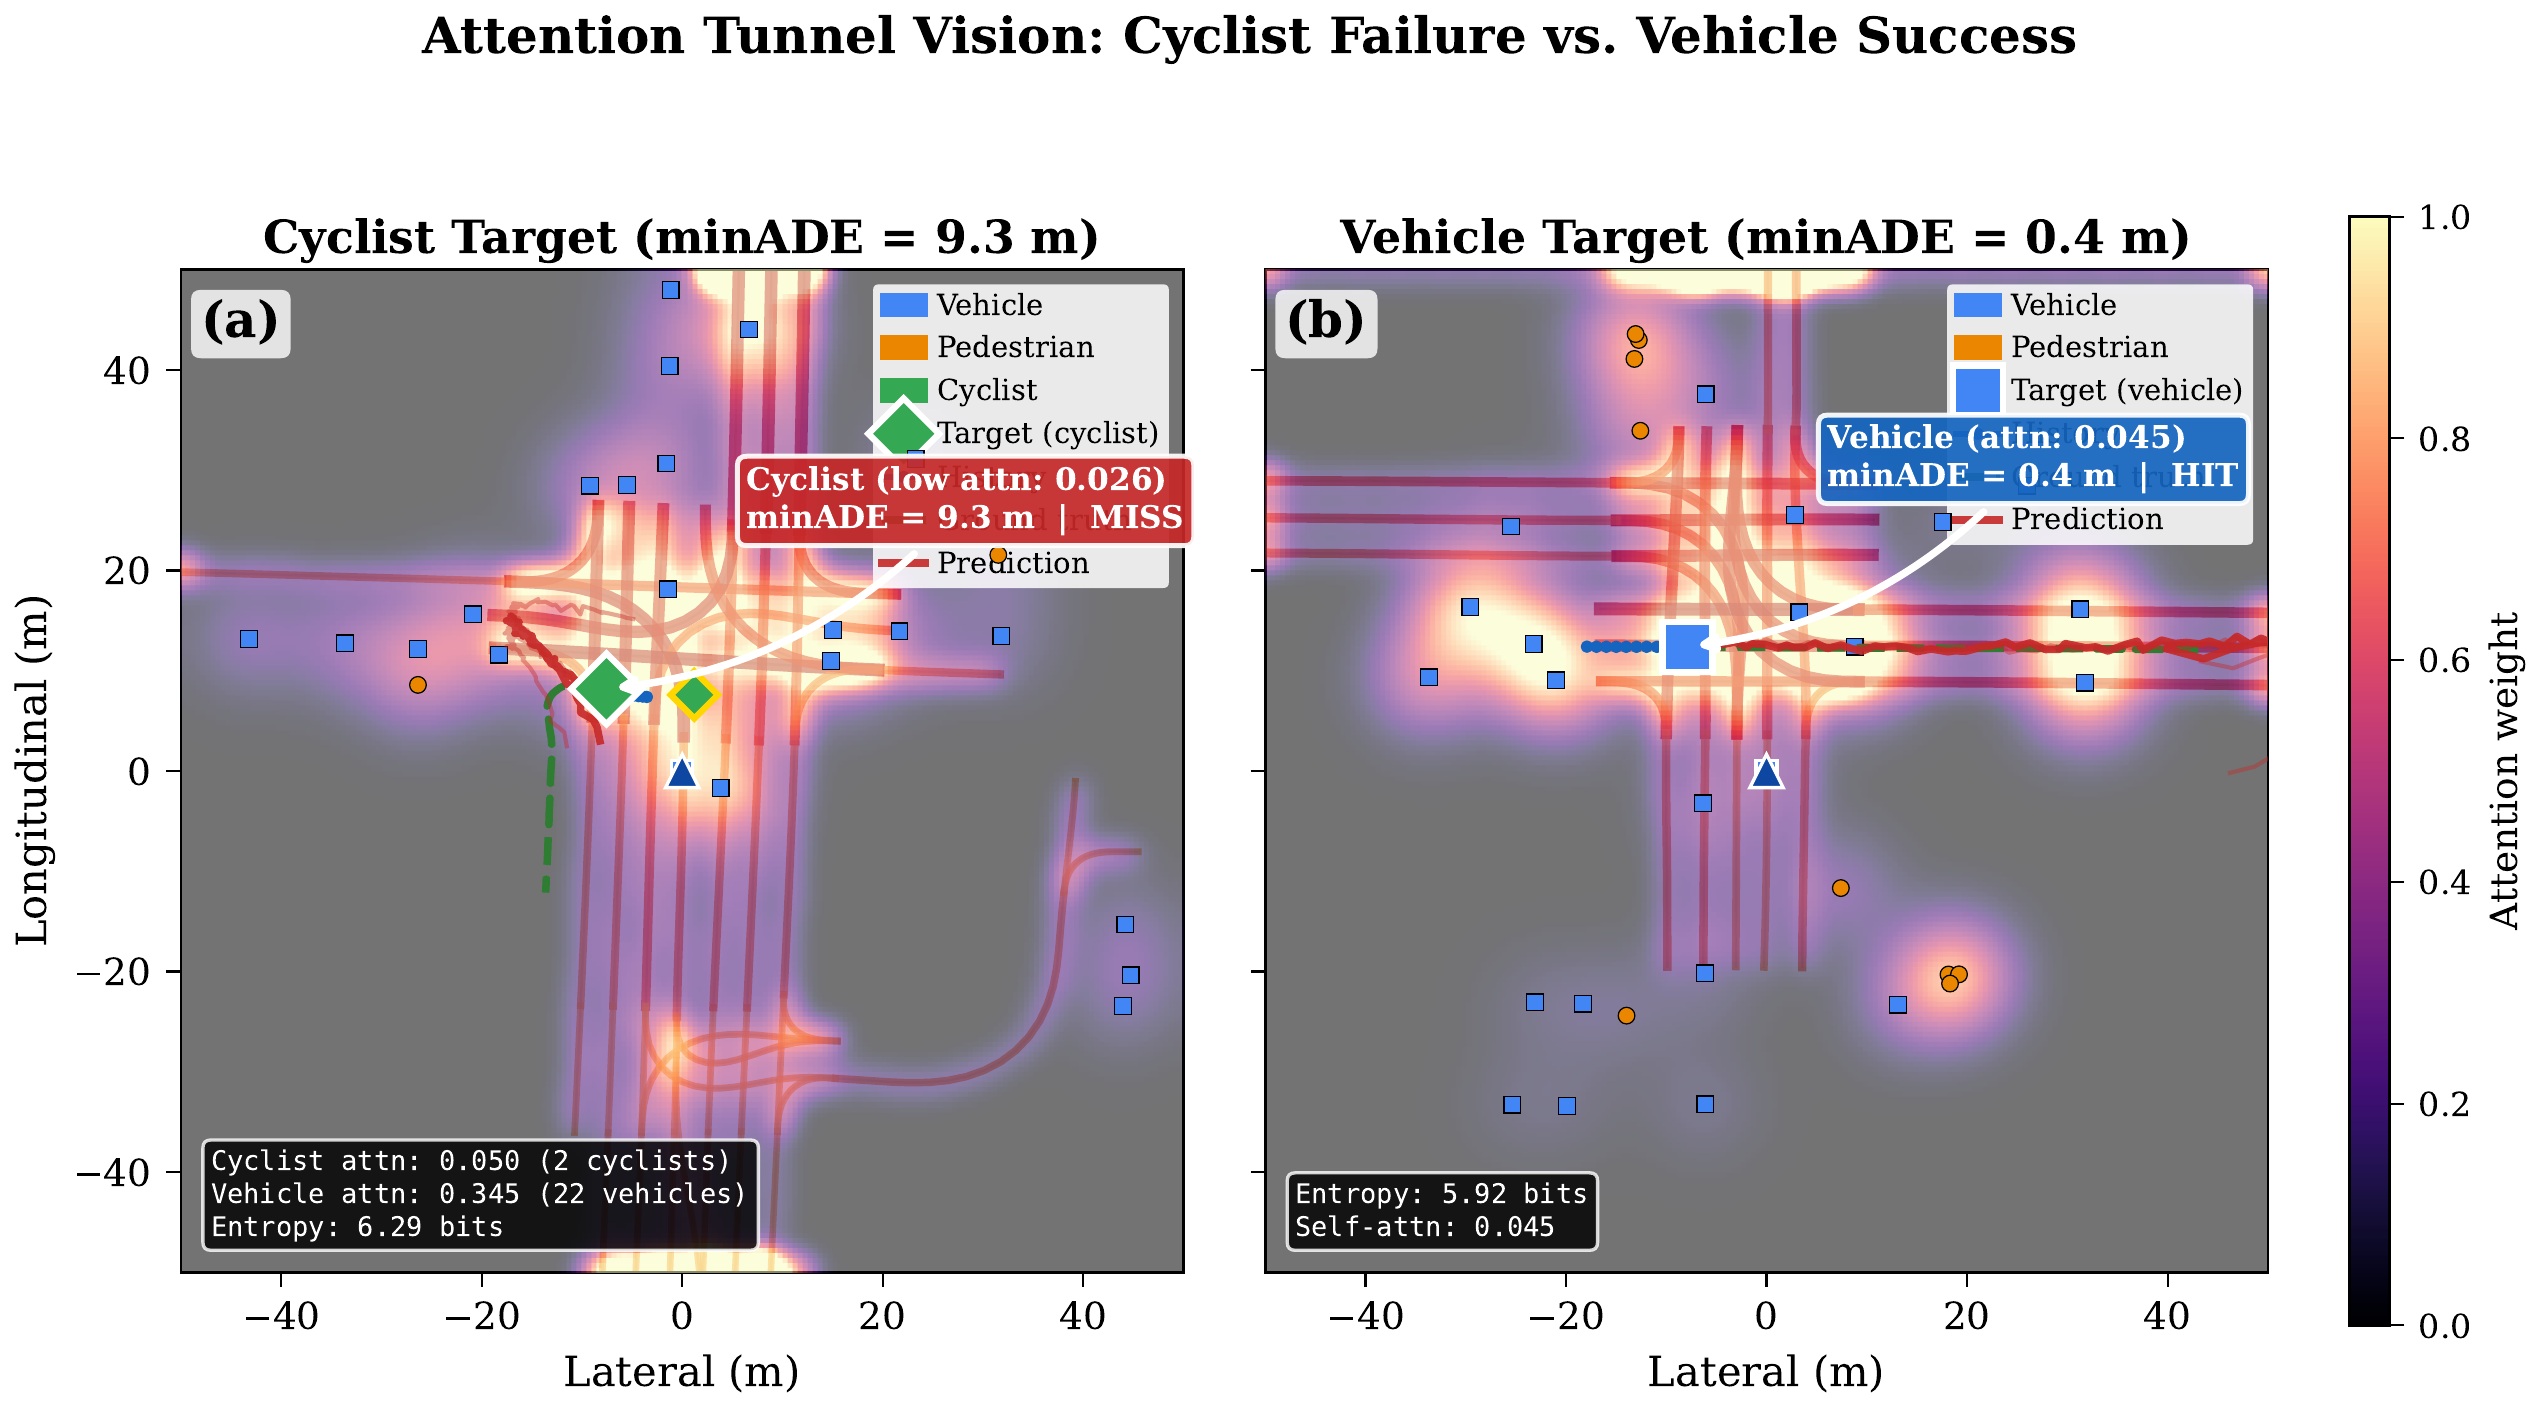
Spatial Attention Analysis
Key Findings
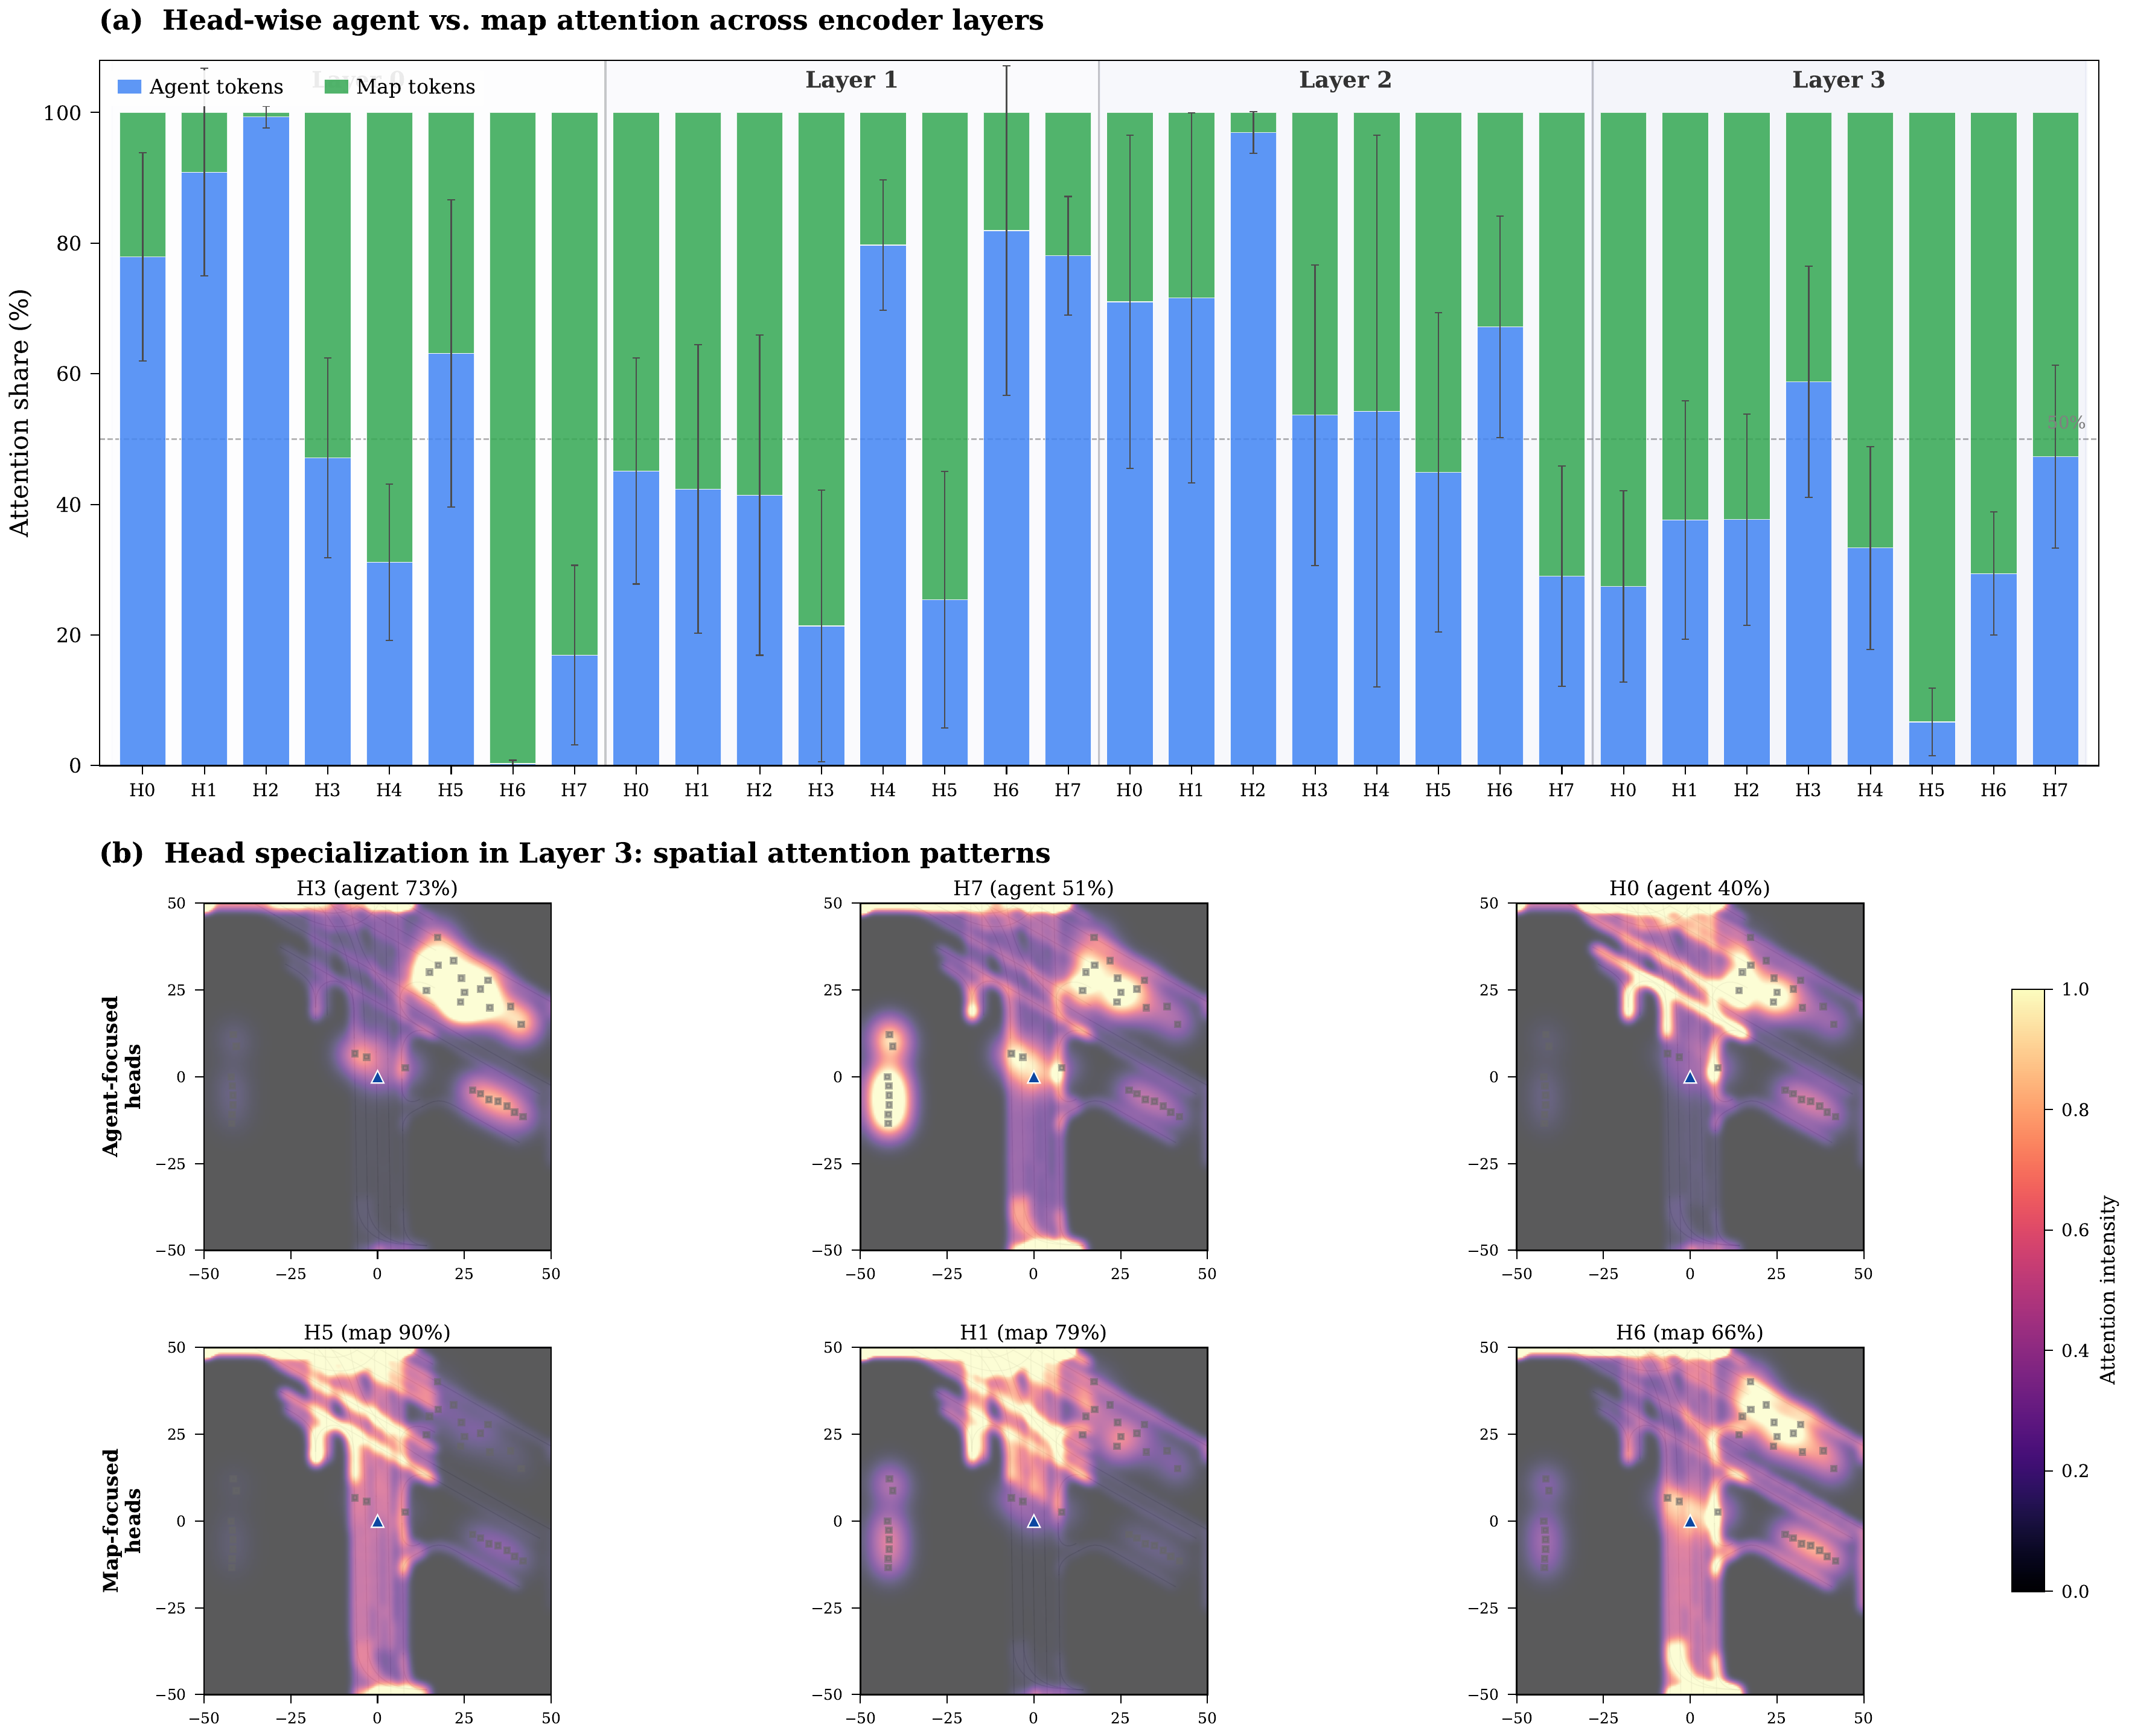
Entropy evolves non-monotonically: 5.64 → 5.50 → 5.36 → 5.92 bits (Layers 0–3). Layers 0–2 progressively narrow focus on agents (agent share: 49.7% → 55.1% → 62.4%), while Layer 3 reverses to broad map attention (63.6% map tokens). This reveals a hierarchical strategy: agent interaction first, then map-conditioned planning.
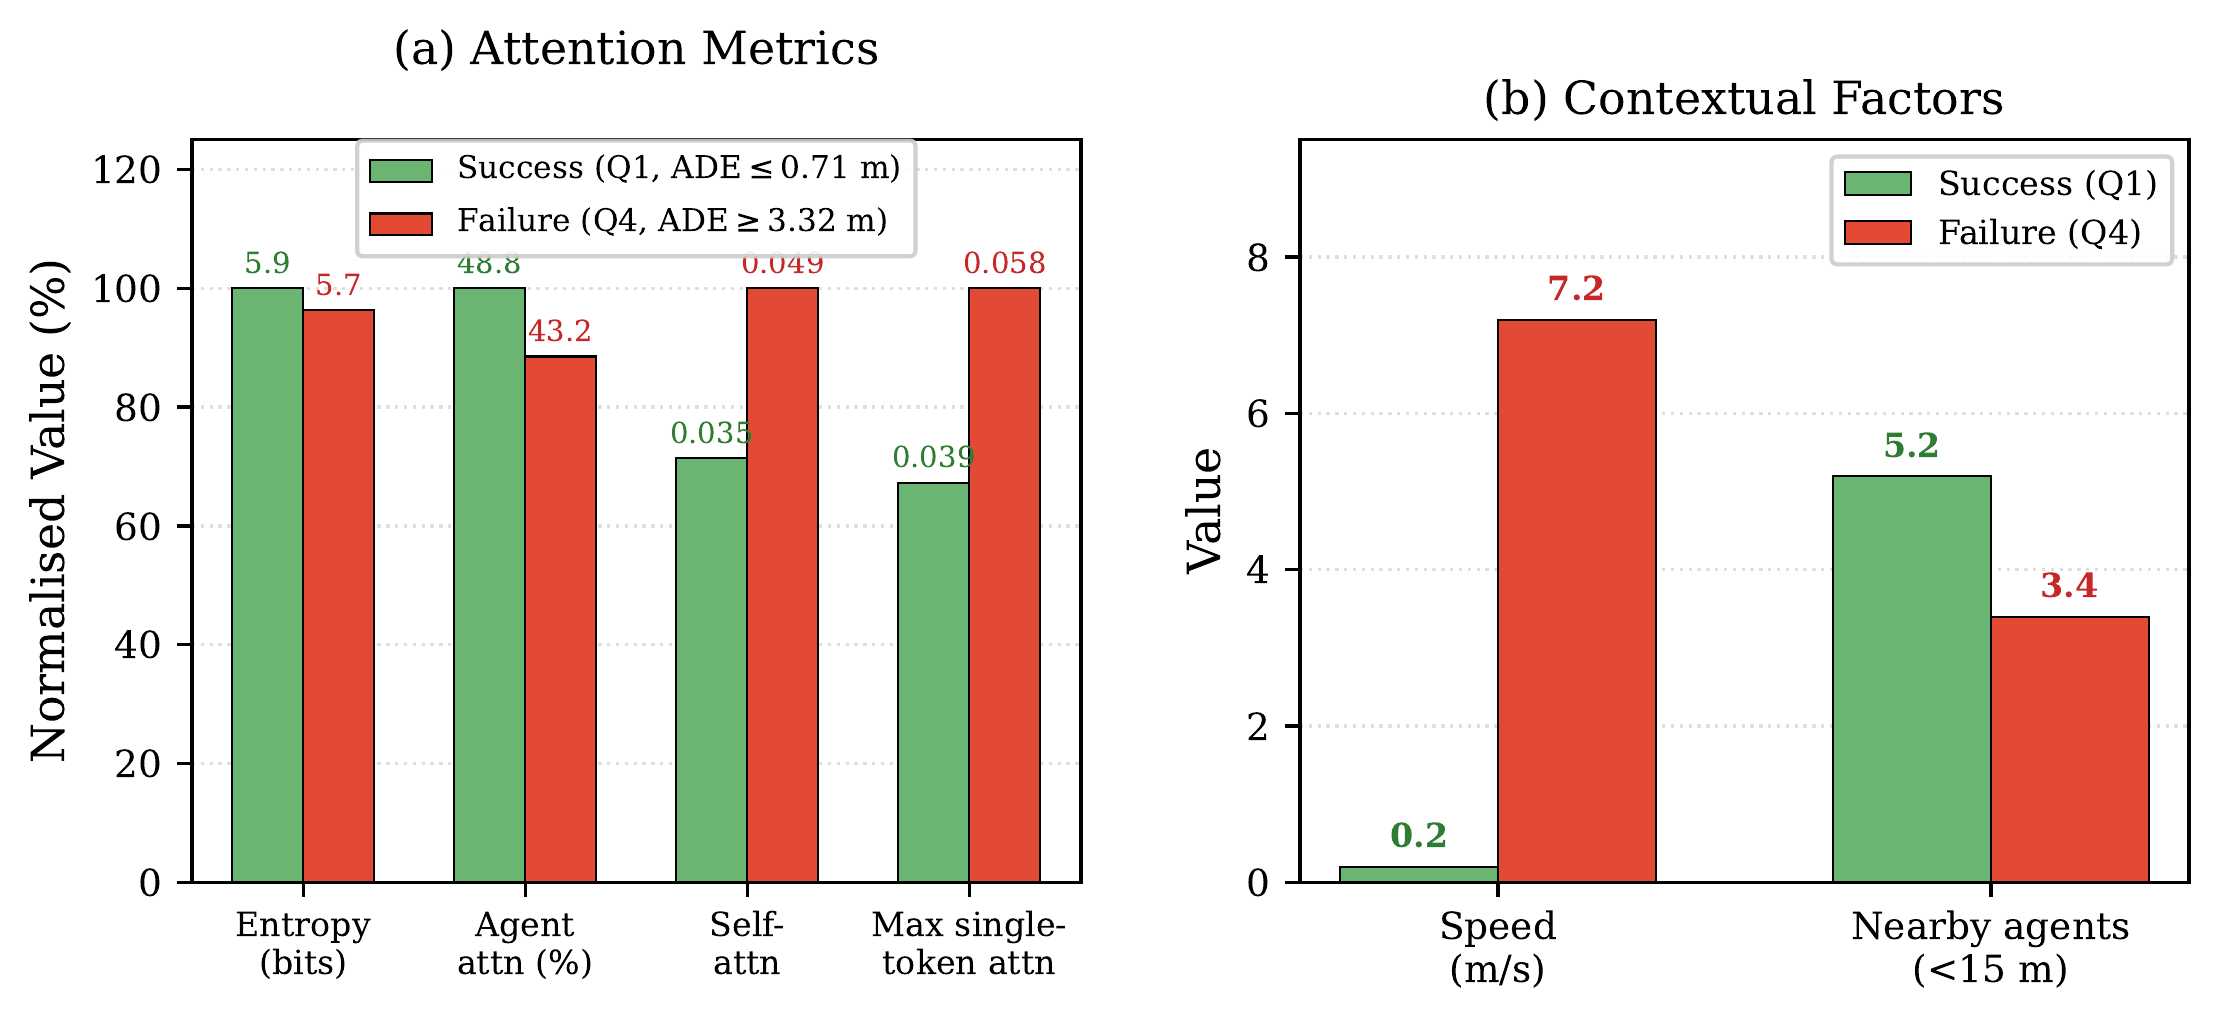
Failed predictions show lower entropy (5.72 vs 5.94 bits in successes), with self-attention 40% higher in failures (0.049 vs 0.035) and max single-token weight 49% higher (0.058 vs 0.039). The model “locks onto” the ego agent instead of distributing attention — a tunnel vision failure pattern.
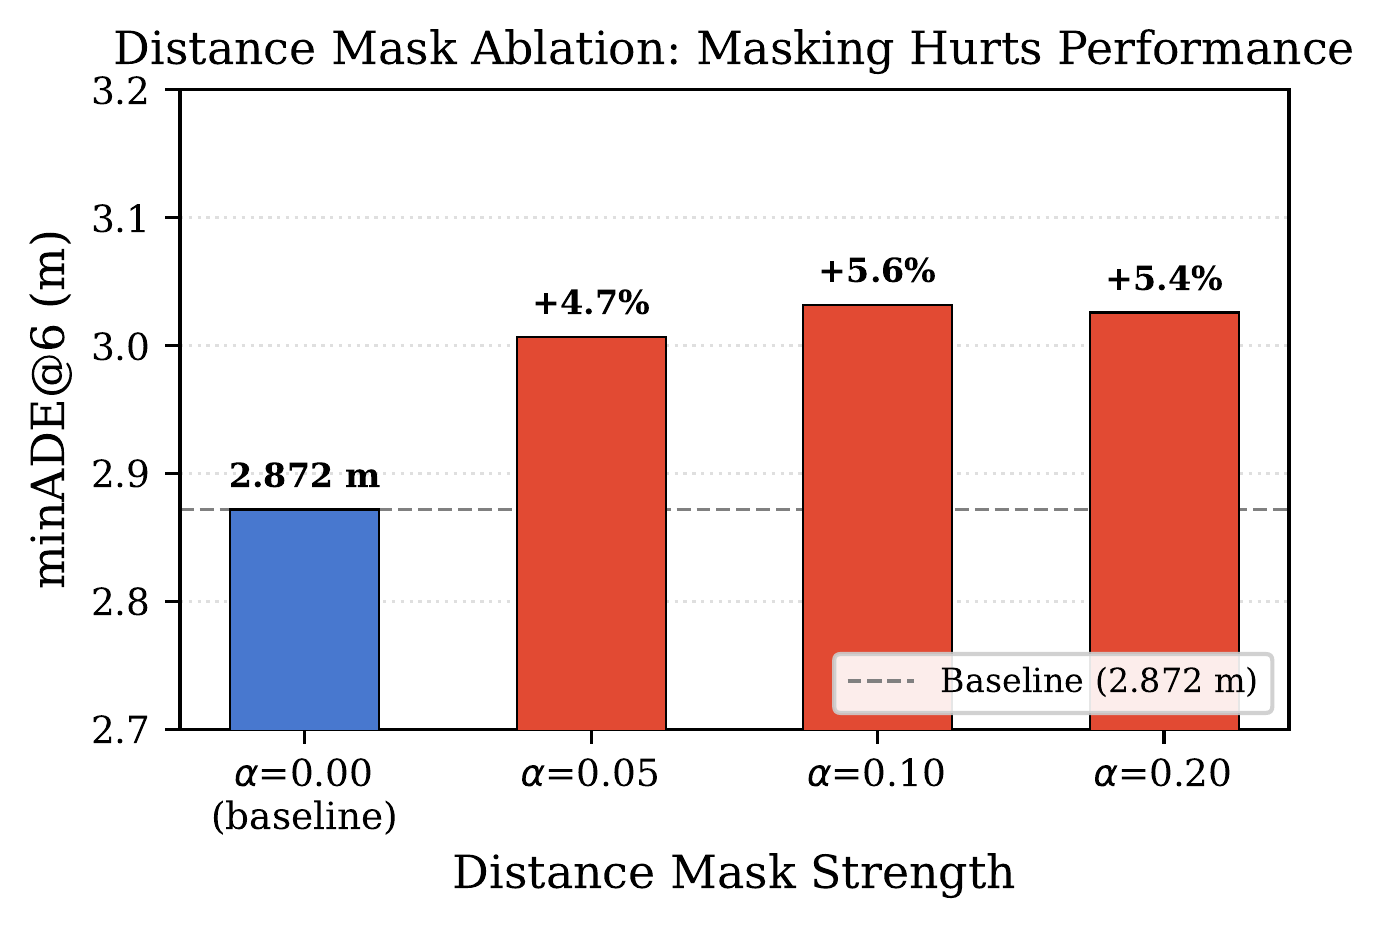
Distance masking at α=0.05 causes +4.7% minADE degradation — even mild far-range suppression hurts accuracy. Far-range agents (30–50m) receive 28.6% of attention despite being numerous. Distance-attention correlation: r = −0.681 (moderate, not extreme), proving far-range context is essential for accurate predictions.
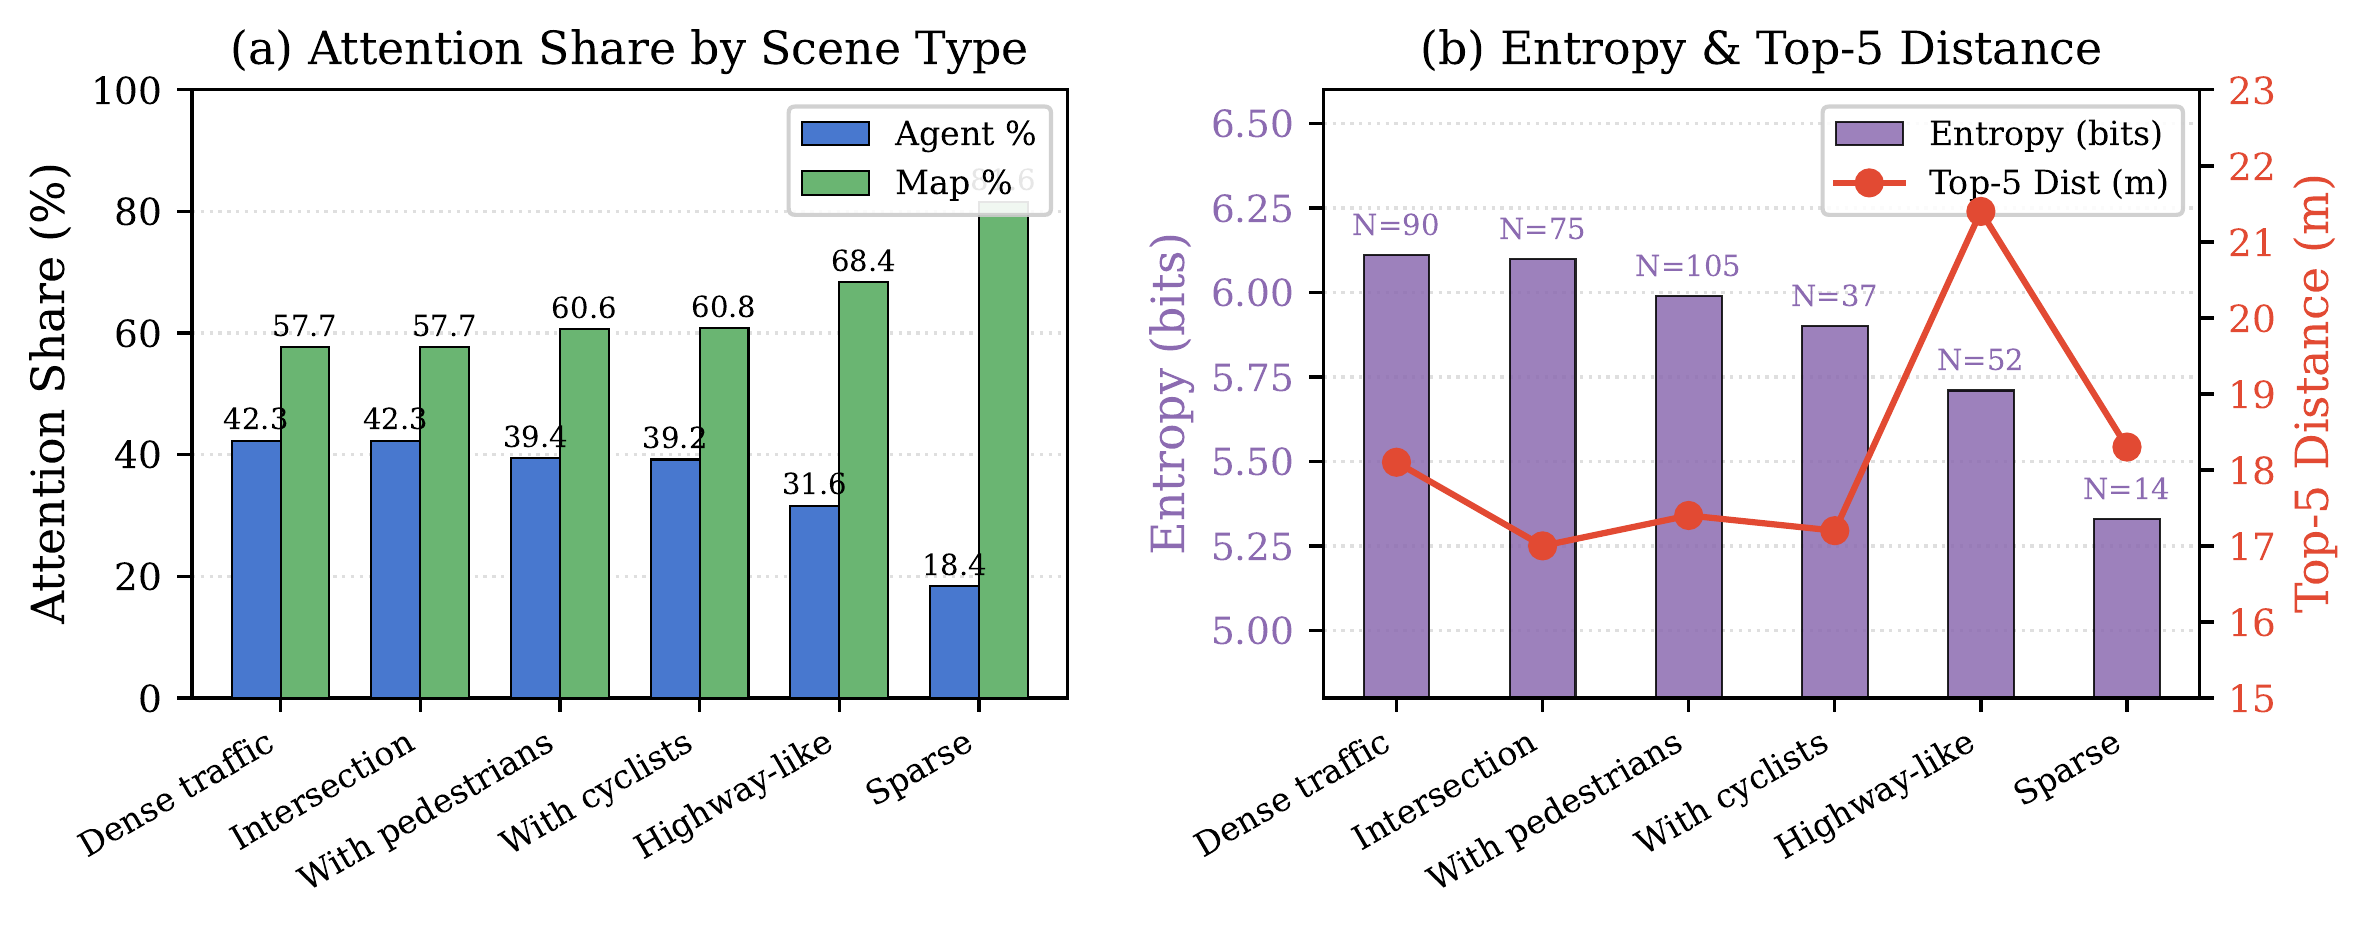
Dense traffic: 42.3% agent attention, entropy 6.11 bits. Sparse scenes: 18.4% agent attention, entropy 5.33 bits. Highway driving shows longer attention reach (21.4m mean top-5 distance), while intersections produce shorter, broader attention (17.0m, entropy 6.10 bits). The model dynamically adapts its attention strategy to scene complexity.
Citation
@article{zhou2026spatial,
  title={Spatial Attention Visualization for Interpretable Trajectory Prediction in Autonomous Driving: Discovering Safety Blind Spots Through Counterfactual Analysis},
  author={Zhou, Xingnan and Alecsandru, Ciprian},
  year={2026},
  note={In Preparation}
}